StaticTextureFrame.setTexture(value)
Specifies the static texture for graphical elements in element script . If the data in the column assigned by the inherited VisualFrame.setField(field) function are GTexture numbers, these data values are used instead of the setTexture() setting. You can also set this using the bindingInfo.textureFrame.texture property syntax in onRefresh script . See Example 2 below. The corresponding “getter” function is getTexture().
Example 1
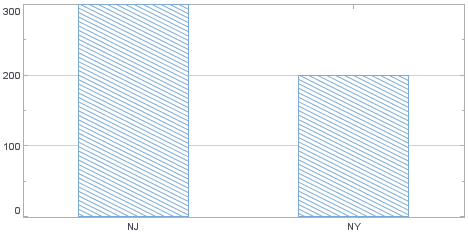
dataset = [["State","Quantity"], ["NJ",300], ["NY",200]];  (1)
graph = new EGraph();
var elem = new IntervalElement("State", "Quantity");
frame = new StaticTextureFrame(); (2)
frame.setTexture(GTexture.PATTERN_18);  (3)
elem.setTextureFrame(frame); (4)
graph.addElement(elem);| 1 | See dataset to use a data block instead of an array literal. |
| 2 | Create the StaticTextureFrame object. |
| 3 | Use setTexture to assign GTexture.PATTERN_18. |
| 4 | Use GraphElement.setTextureFrame(frame) to add the TextureFrame to the IntervalElement. |
Script that modifies the graph or dataset properties should be placed on the Chart component itself. See Add Component Script for more information. This script has access to the Chart data and Chart API methods. Scripted Charts are not good candidates for user-modification, so you should deselect ‘Enable Ad Hoc Editing’ in the Chart Properties dialog box.
|
|
To change the property on a Chart that was previously created with the Chart Editor, use “getter” methods such as EGraph.getElement(index) ① and GraphElement.getTextureFrame() ② to obtain a handle to the desired GraphElement and TextureFrame objects. For example: |
Example 2
This example illustrates how to use bindingInfo properties to control the TextureFrame.
-
Bind a Point Chart to the sample ‘All Sales’ Data Worksheet, with ‘Company’ (top 5) on the X-axis, and Sum(Total) on the Y-axis.
The ‘All Sales’ Data Worksheet can be found in the folder. You may need to download the examples.zip file from GitHub into your environment. (This requires access to Enterprise Manager.) See Import and Export Assets for instructions on how to import. -
Add the following script in the onRefresh handler. (See Add Dashboard Script.)
onRefresh ScriptChart1.bindingInfo.setShapeField("Company",Chart.STRING); Chart1.bindingInfo.textureFrame = new StaticTextureFrame(); Chart1.bindingInfo.textureFrame.texture = GTexture.PATTERN_5;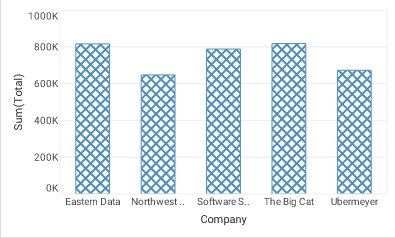
Dashboard script that modifies bindingInfoshould generally be placed in the onRefresh handler. See Add Dashboard Script.