Monitor Server Activity
To monitor and manage a variety of aspects of server activity, press the ‘Monitoring’ button  at the top of Enterprise Manager.
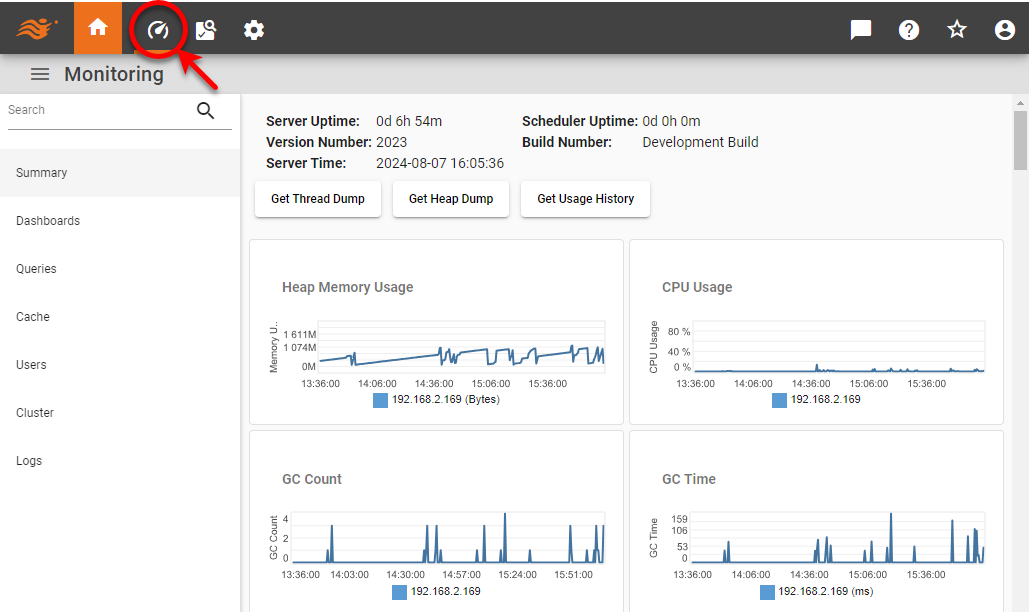
On the pages listed in the left panel you can view Dashboards and queries that are currently executing on the server, and can terminate undesired activity. You can also view currently active users, and terminate any undesired sessions.
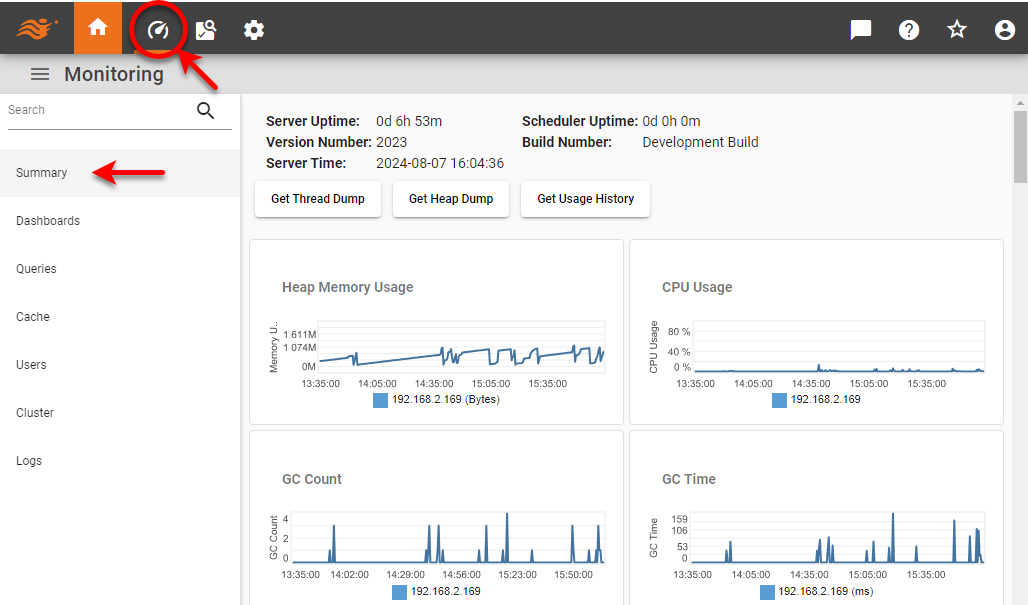
Summary
| In Enterprise Edition, when multi-tenancy is enabled (see Enable Multi-Tenancy), this feature is available to Site Administrators only. |
Use the Summary Monitoring page to track server performance. In a clustered environment, select a machine from ‘Cluster Node’ menu to view the monitoring statistics for that machine. Click on a chart to view the detailed information provided by the corresponding ‘Monitoring’ page.
The following information is available. The ‘Level’ column indicates the monitoring level required for the feature. The level is set by the monitor.level property. (See All Properties for information about how to set properties.)
| Summary | Notes | Level |
|---|---|---|
Heap memory usage |
for all cluster nodes |
None |
CPU usage |
for all cluster nodes |
None |
Garbage Collection Count |
for all cluster nodes |
None |
Garbage Collection Time |
for all cluster nodes |
None |
Server Uptime |
LOW, MEDIUM, HIGH |
|
Scheduler Uptime |
LOW, MEDIUM, HIGH |
|
Version Number |
StyleBI server version |
None |
Memory cache usage |
for data |
MEDIUM, HIGH |
Execution |
for Dashboards, queries |
LOW, MEDIUM, HIGH |
Disk cache usage |
for data |
MEDIUM, HIGH |
Swapping |
“written” to disk cache, and “read” into memory cache |
MEDIUM, HIGH |
Top 5 users |
by count of active Dashboards |
LOW, MEDIUM, HIGH |
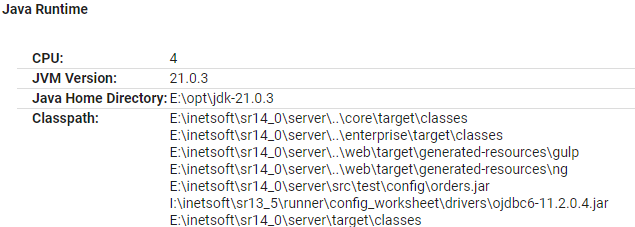
The bottom of the Summary page provides details about the JVM currently being used by the server, including the Java Home Directory and Classpath. If a reverse proxy is in use, this is indicated above the JVM information. If no reverse proxy information appears in that location, this means that no reverse proxy was detected.
Dashboards
Use the Dashboards Monitoring page to access key information about executing Dashboards that are currently being processed by the server, as well as open Dashboards that are active in memory but are not currently being processed.
In a clustered environment, select a machine from ‘Cluster Node’ menu to view the monitoring statistics for that machine.
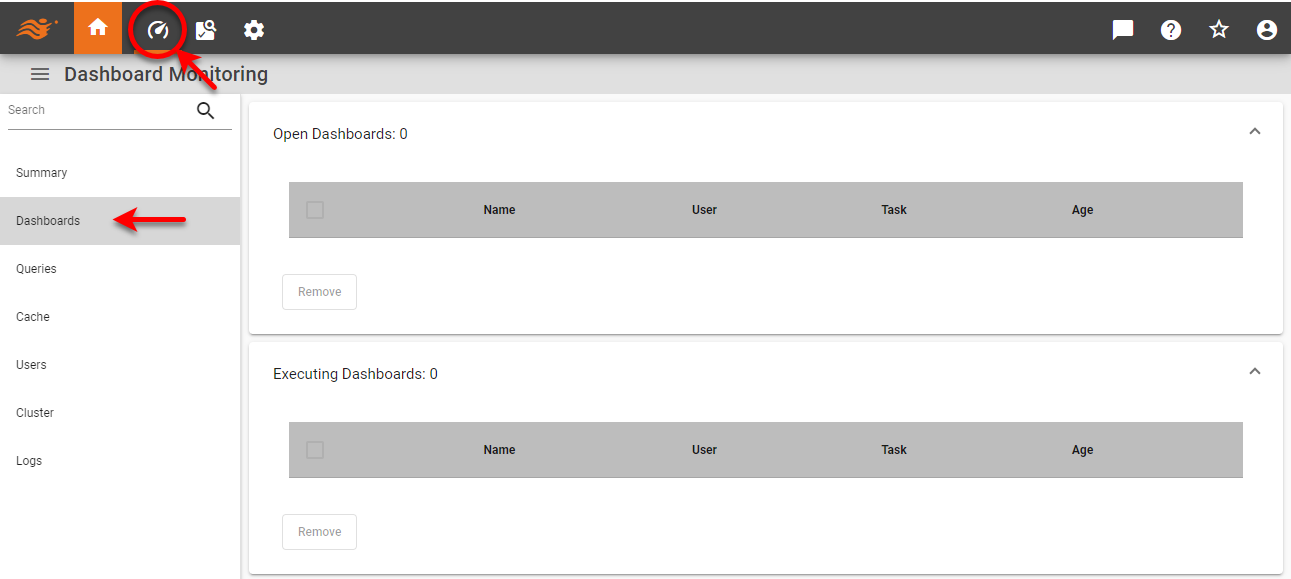
The page provides the following information:
Name |
The name of the Dashboard. |
User |
The user who opened the Dashboard. |
Task |
Scheduled task executing Dashboard. |
Age |
The time elapsed since the Dashboard was opened. |
To terminate a Dashboard, press the ‘Select’ box ![]() next to the Dashboard, and then press the Remove button below the table.
next to the Dashboard, and then press the Remove button below the table.
-
For an executing Dashboard, Remove terminates execution, and removes any cached data.
-
For an open Dashboard, Remove deletes any cached data.
Queries
Use the Queries Monitoring page to access key information about queries currently executing on the server. In a clustered environment, select a machine from ‘Cluster Node’ menu to view the monitoring statistics for that machine.
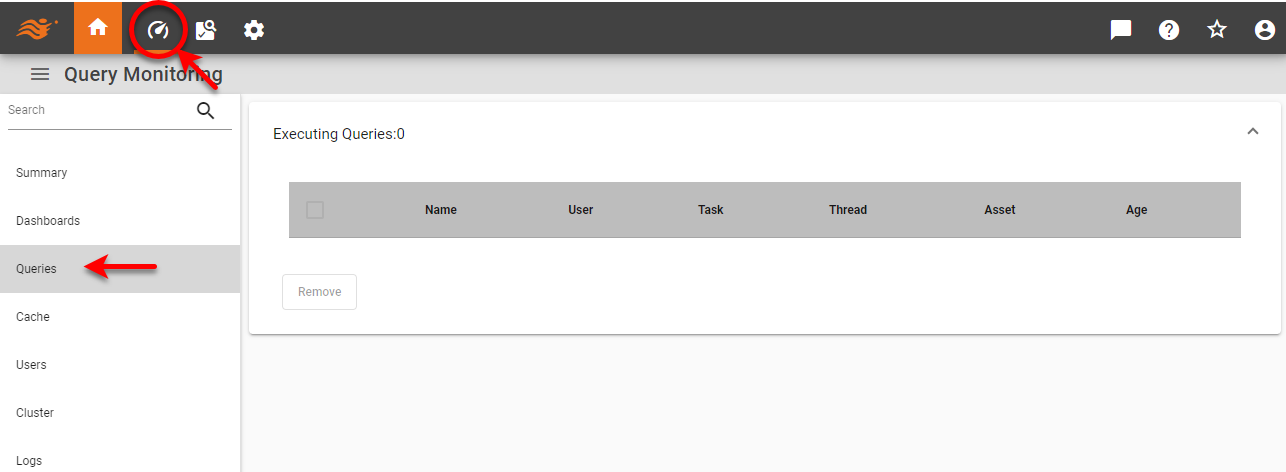
The page provides the following information:
Name |
The name of the query or the Data Worksheet/data model executing the query. |
User |
The user who executed the query. |
Task |
The scheduled task that executed the query. |
Thread |
The thread within which the query is executing. Click the link to obtain a stack trace. |
Asset |
The name of the Dashboard from which the query was executed. |
Age |
The length of time that the query has been executing. |
Cache
| In Enterprise Edition, when multi-tenancy is enabled (see Enable Multi-Tenancy), this feature is available to Site Administrators only. |
| Tailor Performance, for information on configuring caching. |
Use the Cache Monitoring page to access key information for the data cache. In a clustered environment, select a machine from ‘Cluster Node’ menu to view the monitoring statistics for that machine.
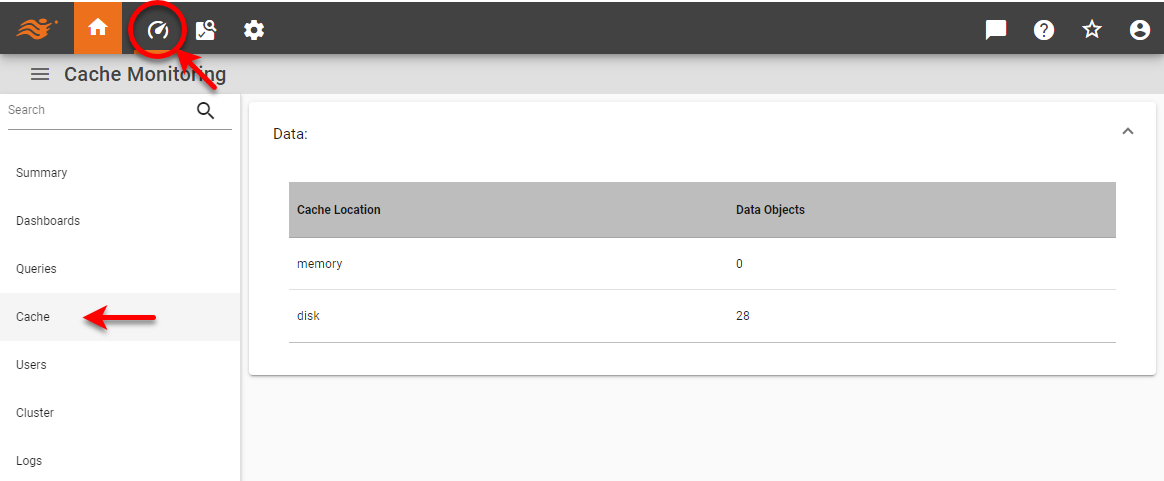
The page provides the following information:
Data Objects |
The number of dataset rows cached in memory or disk. |
Hits |
The number of cache hits. A hit occurs when a query is performed against the cache and a match is found. (Requires the |
Misses |
The number of cache misses. A miss occurs when a query is performed against the cache and no match is found. (Requires the |
Swapped |
The number of bytes swapped from disk to memory, or from memory to disk. (Requires the |
Users
Requires the monitor.level property to be set to ‘High’. See All Properties.
|
Use the Users Monitoring page to access key information about user logins, and allows you to terminate a given user session. In a clustered environment, select a machine from ‘Cluster Node’ menu to view the monitoring statistics for that machine.
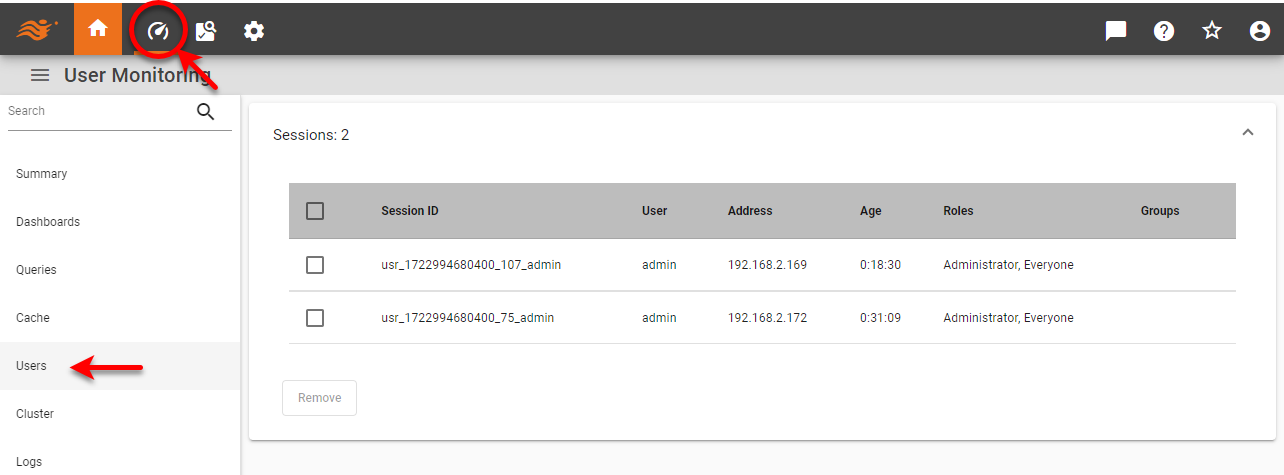
The page provides the following information:
Session ID |
The unique session identifier. |
User |
The user who attempted to log in. |
Address |
The IP address from which the login was attempted. |
Age |
The elapsed time since start of session. |
To terminate a user session, click the ‘Select’ box ![]() next to the desired user, and then press the Remove button.
next to the desired user, and then press the Remove button.
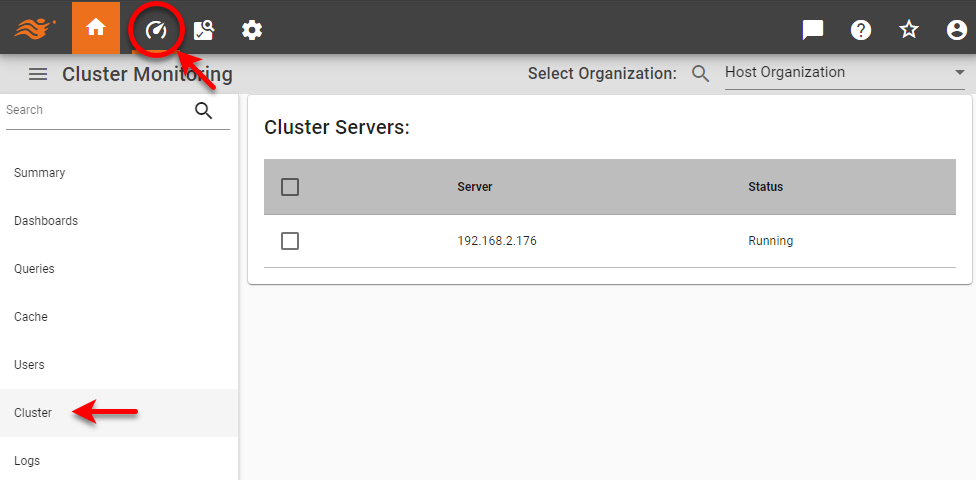
Cluster
| This feature is available only in Enterprise Edition. |
| In Enterprise Edition, when multi-tenancy is enabled (see Enable Multi-Tenancy), this feature is available to Site Administrators only. |
Use the Cluster Monitoring page to view cluster nodes.
Logs
| In Enterprise Edition, when multi-tenancy is enabled (see Enable Multi-Tenancy), this feature is available to Site Administrators only. |
| Logging, for information on how to configure logging behavior. |
Use the Logs Monitoring page to view and download server and scheduler logs.
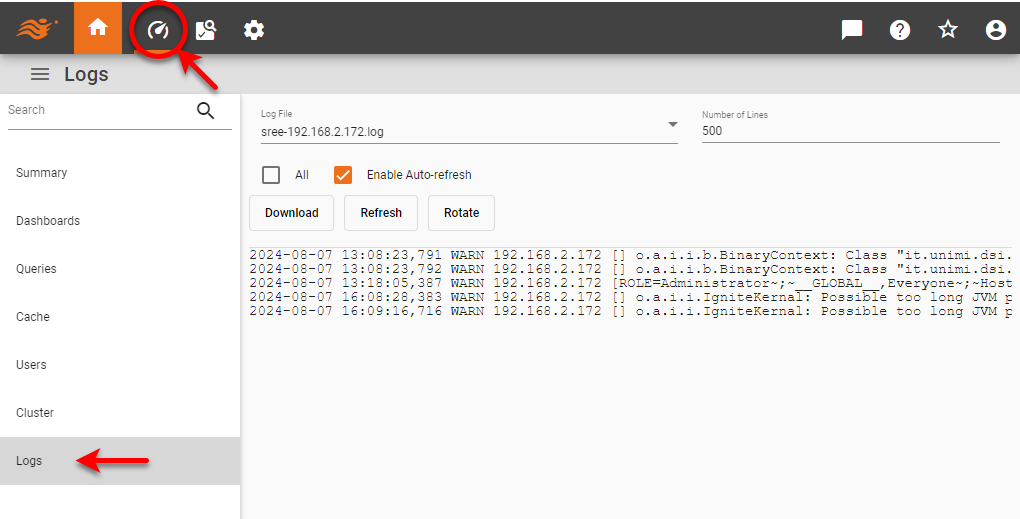
To do this follow the steps below:
-
From the ‘Log file’ menu, select ‘sree.log’ for the InetSoft server log or ‘schedule.log’ for the Scheduler log. This will display the selected log.
If the log size has exceeded the ‘Maximum Log File Size’ set on the Logging page (see Logging), you will see multiple log files listed. -
Select the ‘All’ option to display the entire contents of the log file (maximum 3000 lines by default), or enter the ‘Number of Lines’ from the end of the file to display.
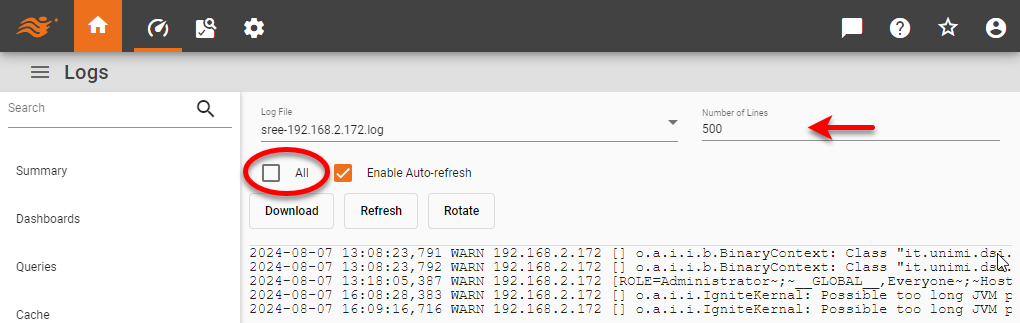
-
Select ‘Enable Auto-refresh’ to allow the display to update automatically as new lines are written to the log.
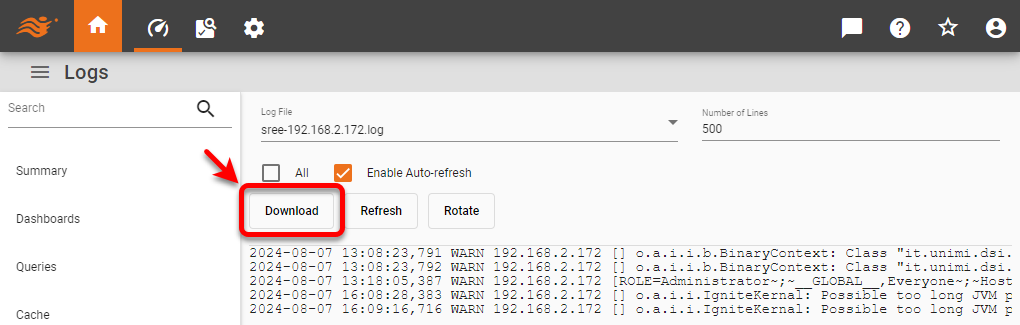
-
To download a zip archive containing all log files, press the Download button at the top of the page.
-
To refresh the display with current log records, press the Refresh button (only available when ‘Enable Auto-refresh’ is disabled).
-
To start a new log file, press the Rotate button. This saves the current log file under an automatically-generated name such as sree-IP_Address-index.log. or schedule-IP_Address-index.log, and begins adding log records to a new log file.
| These log monitoring settings are not retained following a server restart. |