Access Datasource Data
You can access data contained in the Dashboard data source from within any Dashboard script. The following sections explain the syntax for accessing data from the data source data. See Access Component Data for information on how to access the specific data represented in a component.
Reference Datasource Data
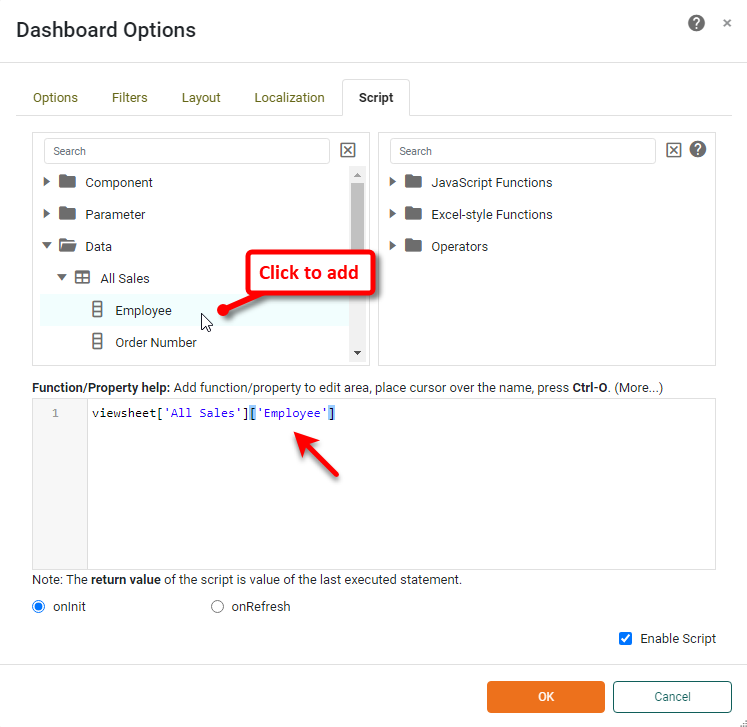
You can access data from the Dashboard’s data source from within any script. To do this, click the desired data field under the ‘Data’ folder in the Editor to insert the field into the script.
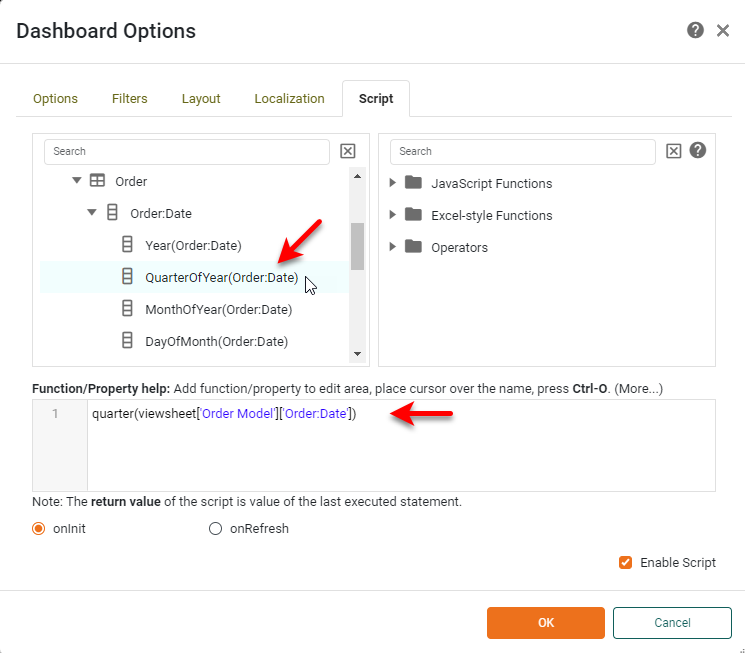
Note that Date-type fields supply the following date parts: Year, QuarterOfYear, MonthOfYear, DayOfMonth, and DayOfWeek. Time-type fields supply the following date parts: HourOfDay, MinuteOfHour, SecondOfMinute. TimeInstant-type fields supply all of the previous date parts.
For example, to access a value in a Data Worksheet data block called ‘TopSales’, select the field from the ‘Data’ folder as described above, or manually type the desired reference. Some examples are shown below:
| In general, data block operations should be performed in the Data Worksheet rather than the Dashboard. |
// Array of all values in ‘Price’ field from ‘TopSales’:
TopSales['Price']

// Third row, fifth column from ‘TopSales’:
TopSales[2][4]

// Third row of the ‘Price’ field in from ‘TopSales’:
TopSales[2]['Price']
If the data source name contains a space (e.g., ‘Top Sales’), use the viewsheet keyword to form the reference, as shown below:
viewsheet['Top Sales']['Price']You can access data from a data model in the same manner. For example, to access data from the ‘Product Name’ attribute of the ‘Order Model’ data model, use the following syntax. (Use the viewsheet keyword because the name contains a space):
viewsheet['Order Model']['Product:Name']To perform aggregations on referenced data from within the script, see Aggregate Data.
Consider a Dashboard that uses the ‘Sales Explore’ Data Worksheet as its data source, and you want a single Text component to display the range of dates contained in the ‘Date’ field of the ‘Sales’ data block. You can do this by referencing the desired dates directly from the ‘Sales’ data block in an onInit script, as shown below. (See Add Dashboard Script for more information about the onInit handler.) Data from the ‘Date’ field of the ‘Sales’ data block is available in array Sales['Date'].
| The 'Sales Explore' Data Worksheet can be found in menu:Data Worksheet[Examples]. You may need to download the examples.zip file from GitHub into your environment. (This requires access to Enterprise Manager.) See Import and Export Assets for instructions on how to import. |
// Latest value in ‘Date’ field from ‘Sales’ data block:
var lastDate = Last(Sales['Date'], Sales['Date']);
// Earliest value in ‘Date’ field from ‘Sales’ data block:
var firstDate= First(Sales['Date'], Sales['Date']);
You can then add a script to a Text component to display the date range in the desired manner. (See Add Component Script for more information about scripting a component.)
Text1.text = 'Data from ' + formatDate(firstDate,'MMM d, yyyy') + ' to ' + formatDate(lastDate,'MMM d, yyyy') ;Aggregate Data
|
To aggregate data from the data source within Dashboard script, use the following syntax:
aggregationMethod(data_reference)| In general, data block operations should be performed in the Data Worksheet rather than the Dashboard. |
See Reference Datasource Data for the syntax of the data reference. For example, to obtain the sum or average of the column ‘Price’ from data block ‘TopSales’, use an expression such as the following:
var sumPrice = Sum(TopSales['Price'])
var avePrice = Average(TopSales['Price'])
To reference a data source that has a space in the name (e.g., “Top Sales”), use the viewsheet keyword as follows:
var avePrice = Average(viewsheet['Top Sales']['Price'])The following aggregation methods are available. These functions are not case-sensitive (e.g., “Sum” and “sum” are both valid.) Note that you can use other functions from the Function Library as well, for example CALC Object Functions.
| Aggregation Methods | Function Example | Description |
|---|---|---|
Sum |
Sum(Sales['Total']) |
Returns the sum of the values in the column (array). |
Average |
Average(Sales['Total']) |
Returns the average of the values in the column (array). |
Max |
Max(Sales['Total']) |
Returns the maximum of the values in the column (array). |
Min |
Min(Sales['Total']) |
Returns the minimum of the values in the column (array). |
Count |
Count(Sales['Total']) |
Returns the number of values in the column (array). |
CountDistinct |
CountDistinct(Sales['Total']) |
Returns the number of unique values in the column (array). |
First |
First(Sales['Total'], Sales['State']) |
Returns the first value in the first column (array) when sorted based on the values in the second column (array). |
Last |
Last(Sales['Total'], Sales['State']) |
Returns the last value in the first column (array) when sorted based on the values in the second column (array). |
Stdev |
Stdev(Sales['Total']) |
Returns the sample standard deviation of the values in the column (array). |
VarN |
VarN(Sales['Total']) |
Returns the sample variance of the values in the column (array). |
StdevP |
StdevP(Sales['Total']) |
Returns the population standard deviation of the values in the column (array). |
VarP |
VarP(Sales['Total']) |
Returns the population variance of the values in the column (array). |
Correl |
Correl(Sales['Total'],Sales['Quantity Purchased']) |
Returns the correlation between the values in the first column (array) and the values in the second column (array). |
Covar |
Covar(Sales['Total'],Sales['Quantity Purchased']) |
Returns the population covariance between the values in the first column (array) and the values in the second column (array). |
Median |
Median(Sales['Total']) |
Returns the median of the values in the column (array). |
Mode |
Mode(Sales['Total']) |
Returns the mode of the values in the column (array). |
WeightedAvg |
WeightedAvg(Sales['Total'], Sales['Quantity Purchased']) |
Returns the average of the values in the first column (array) weighted by the values in the second column (array). |
NthLargest |
NthLargest(Sales['Total'], n) |
Returns the nth-largest of the values in the column (array). |
NthSmallest |
NthSmallest(Sales['Total'], n) |
Returns the nth-smallest of the values in the column (array). |
NthMostFrequent |
NthMostFrequent(Sales['Total'], n) |
Returns the nth-most frequent of the values in the column (array). |
PthPercentile |
PthPercentile(Sales['Total'], p) |
Returns the pth-percentile value for the column (array). |
Consider a Dashboard that uses the ‘Sales Explore’ Data Worksheet as its data source, and you want a single Text component to display the range of values contained in the ‘Total’ field of the ‘Sales’ data block. You can do this by referencing the desired dates directly from the ‘Sales’ data block in an onInit script, as shown below. (See Add Dashboard Script for more information about the onInit handler.)
| The 'Sales Explore' Data Worksheet can be found in menu:Data Worksheet[Examples]. You may need to download the examples.zip file from GitHub into your environment. (This requires access to Enterprise Manager.) See Import and Export Assets for instructions on how to import. |
Data from the ‘Total’ field of the ‘Sales’ data block is available in array Sales['Total'].
// Largest value in ‘Total’ field from ‘Sales’ data block:
var maxT = Max(Sales['Total']);
// Smallest value in ‘Total’ field from ‘Sales’ data block:
var minT= Min(Sales['Total']);
You can then add a script to a Text component to display the number range in the desired manner. (See Add Component Script for more information about scripting a component.)
Text1.text = 'Totals range from ' + formatNumber(minT,'$#,###.00') + ' to ' + formatNumber(maxT,'$#,###.00');