EGraph.addElement(elem)
|
Adds the specified GraphElement to the chart. See Chart Elements for available elements. The inverse operations are EGraph.removeElement(idx) and EGraph.clearElements().
Parameter
- elem
-
a GraphElement object
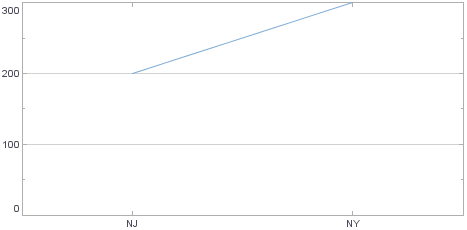
Example
Chart Component Script
dataset = [["State", "Quantity"], ["NJ", 200], ["NY", 300]]; (1)
graph = new EGraph();
var elem = new LineElement("State", "Quantity");
graph.addElement(elem); (2)| 1 | See dataset to use a data block instead of an array literal. |
| 2 | Use addElement to add the LineElement to Chart. |
Script that modifies the graph or dataset properties should be placed on the Chart component itself. See Add Component Script for more information. This script has access to the Chart data and Chart API methods. Scripted Charts are not good candidates for user-modification, so you should deselect ‘Enable Ad Hoc Editing’ in the Chart Properties dialog box.
|