Mashup Data
This section describes how to create a new data block by simple drag-and-drop operations.
When to Use
This approach is especially useful in the following cases:
-
You are creating a data set from a data model. In this case, you do not need to define any joins because all joins are already defined in the data model.
-
You need to mash up data from different data sources.
If you do not have a data model, and need to create joins on a single datasource, the approach described in Query Data may produce the desired data set more efficiently than the approach described here.
Basic Steps
Watch Video: Create a New Data Block
This video might show an earlier version of the feature or operation that differs in minor ways from the current version.
To create a data set in the User Portal by mashing up data with drag-and-drop operations, follow the steps below:
-
Log into the User Portal.
You may see the ‘Create Visualization’ dialog box.
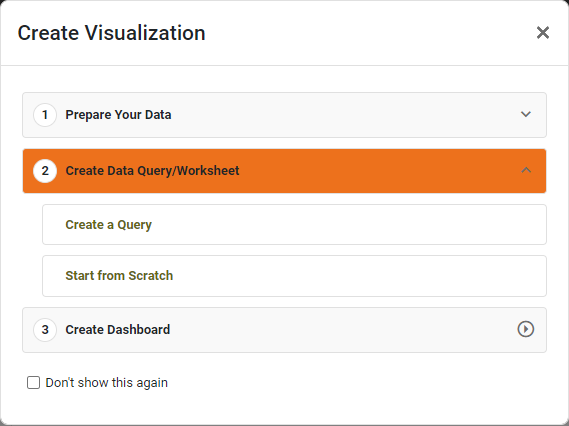
Press the ‘Close’ button
 to continue with the steps below (recommended), or press Start from Scratch to skip the ‘New Data Worksheet’ dialog box (equivalent to selecting ‘Mashup Data’
  ).
). -
Press the ‘Create’ button
 at the top of the User Portal, and select the ‘Data Worksheet’
  option.
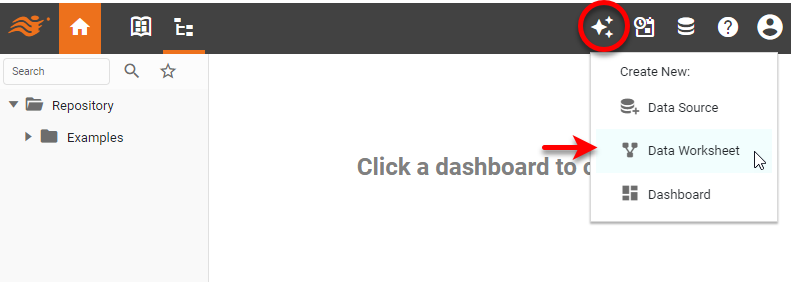
This opens Visual Composer in a separate browser tab and displays the ‘New Data Worksheet’ dialog box.
-
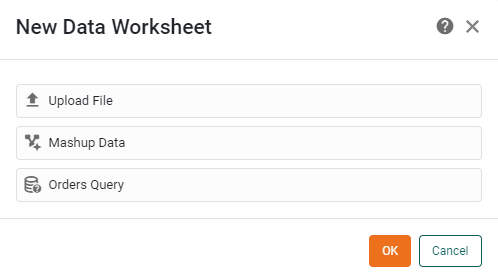
Choose the ‘Mashup Data’
option. This creates a blank Data Worksheet named ‘Untitled-X’, where X is an auto-incremented integer.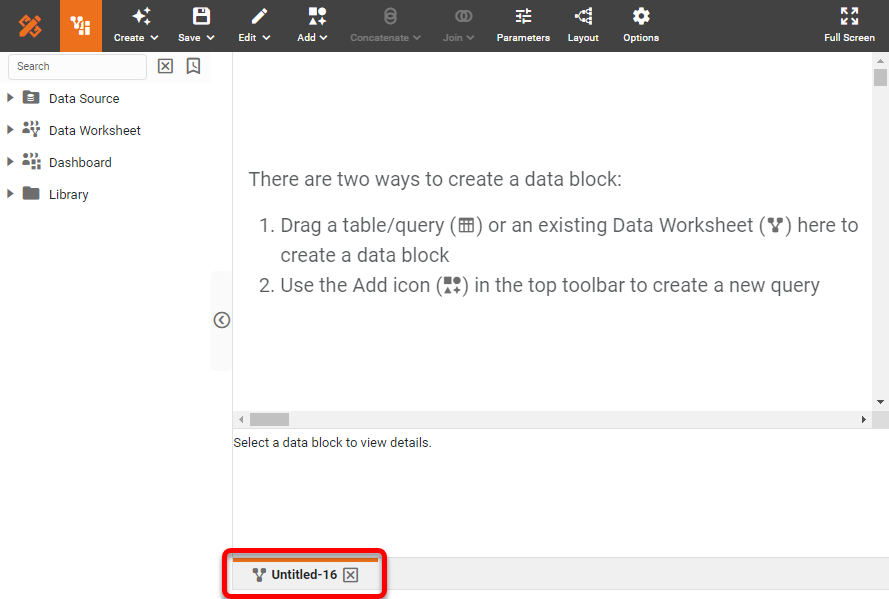
-
Proceed to add data blocks to the Data Worksheet. Drag the desired data (attributes, fields, or tables) from the left panel.
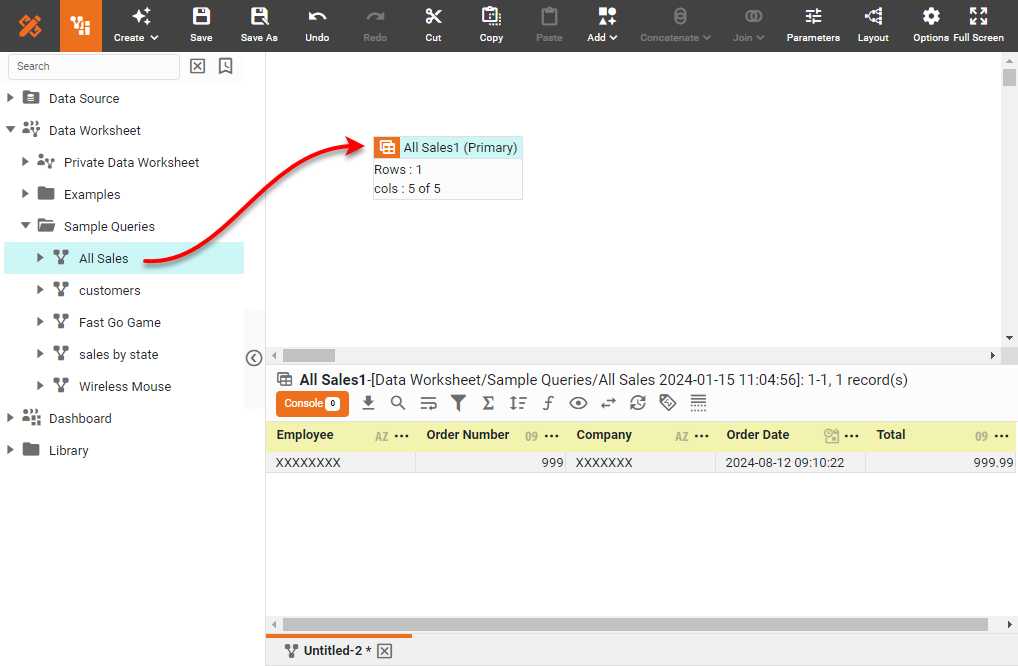
You can also drag a data block (or individual columns of a data block) from another Data Worksheet. In this case, the inserted data block remains linked to the original Data Worksheet in which it is defined, and updates automatically in response to changes in the source Data Worksheet. To disable this auto-update behavior, press the ‘Disable Auto Update’ button
 in the toolbar of the bottom panel.
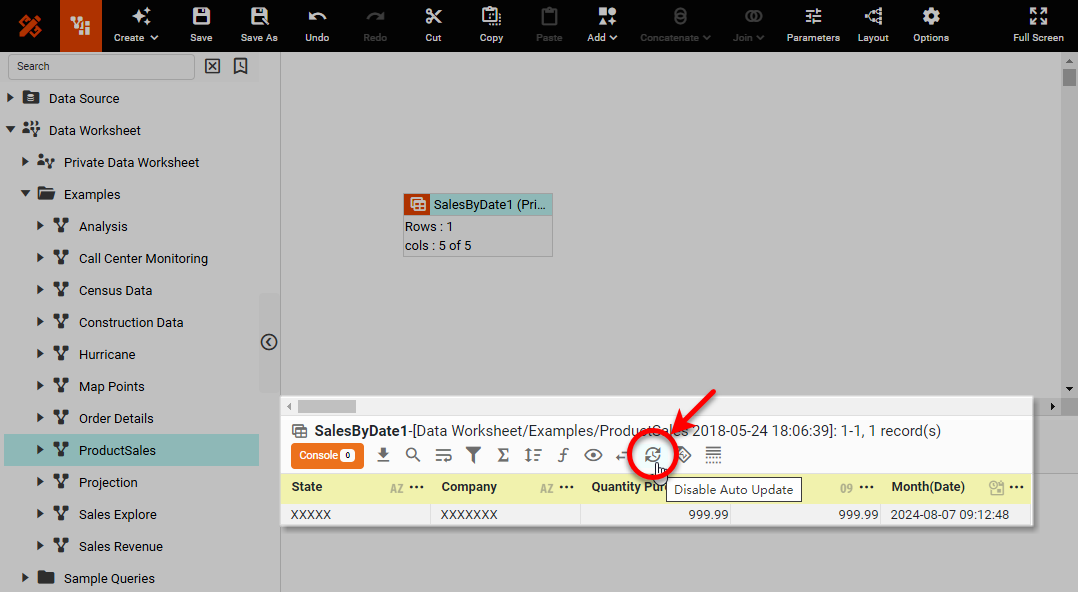
You can then force an update on-demand by right-clicking the data block (or by pressing the ‘Actions’ button
 ) and selecting the ‘Update Mirror’ option. To restore the original auto-update behavior, press the ‘Enable Auto Update’ button
  .
. -
Optional: To modify the properties of a column in a data block, such as its name, visibility, position, sort order, see Modify a Column.
-
Optional: To view the query represented by the data block, see Preview Query. To preview the data returned by the data block, see Preview Data.
-
Mark your final result as the primary data block. To do this, right-click the data block and select ‘Set as Primary’ from the context menu. Note: You can also access menu options from the ‘More’ button (
) in the mini-toolbar. This makes the data block visible to other Data Worksheets, and places it first in the list of data blocks available to any Dashboard that uses this Data Worksheet as its data source.
You can now do data pipeline operations on this data, such as Join Data, Group and Aggregate Data, and Sort Data, or you can proceed to create Dashboards based on this Data Worksheet. See Visualize Your Data for more details on building a Dashboard.