bindingInfo.pathField
Specifies the field to be used in the ‘Path’ binding. See Map Chart for more information about ‘Path’.
Type
Array: [Field,Type]
-
Fieldis a field name (String) -
Typeis one ofChart.STRING,Chart.DATE, orChart.NUMBER
Example
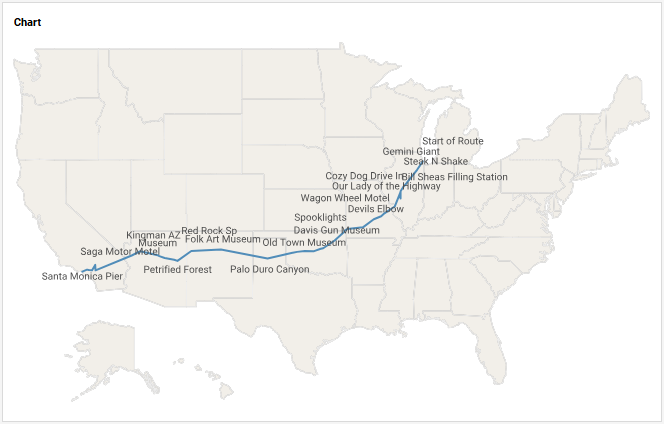
For a Dashboard with ‘Map Points’ Data Worksheet as data source.
| The ‘Map Points’ Data Worksheet can be found in the folder. You may need to download the examples.zip file from GitHub into your environment. (This requires access to Enterprise Manager.) See Import and Export Assets for instructions on how to import. |
Chart1.query = "Data";
Chart1.chartStyle = Chart.CHART_MAP;
Chart1.bindingInfo.yFields = [['Lat',Chart.NUMBER]];
Chart1.bindingInfo.xFields = [['Long',Chart.NUMBER]];
Chart1.bindingInfo.pathField = ['Long',Chart.NUMBER]; (1)
Chart1.bindingInfo.setTextField('Name',Chart.STRING); (2)
Chart1.mapType = Chart['MAP_TYPE_U.S.'];| 1 | Sets ‘Long’ as the path field. Path will be drawn through ascending longitude values. |
| 2 | Use bindingInfo.setTextField(col, type) to place names on the points. |
Dashboard script that modifies bindingInfo should generally be placed in the onRefresh handler. See Add Dashboard Script.
|