EGraph.setLegendLayout(value)
| setActionVisible(name, Boolean) to control the ability of a user to position the legend and to access other Chart features. |
Specifies the Chart legend’s position. The corresponding “getter” function is EGraph.getLegendLayout().
Paramater
- value
-
One of the following constants:
Chart.NONE      // (0) No legend
Chart.BOTTOM    // (3) Below X-axis title, aligned left
Chart.TOP       // (1) Above graph, aligned left
Chart.LEFT      // (4) To left of Y-axis title, aligned top
Chart.RIGHT     // (2) To right of graph, aligned top (default)
Chart.IN_PLACE  // (5) Superimposed on graph
Example
Chart Component Script
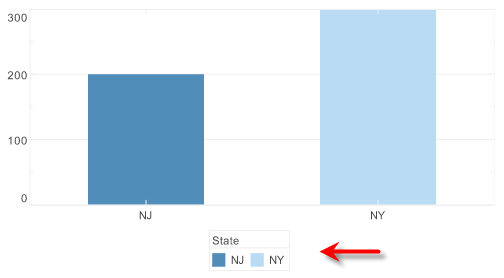
dataset = [["State", "Quantity"], ["NJ",200], ["NY",300]];
graph = new EGraph();
var elem = new IntervalElement("State", "Quantity");
var frame = new CategoricalColorFrame();
frame.setField("State");
elem.setColorFrame(frame);
graph.setLegendLayout(Chart.BOTTOM); (1)
graph.addElement(elem);| 1 | Set the legend layout. |
Script that modifies the graph or dataset properties should be placed on the Chart component itself. See Add Component Script for more information. This script has access to the Chart data and Chart API methods. Scripted Charts are not good candidates for user-modification, so you should deselect ‘Enable Ad Hoc Editing’ in the Chart Properties dialog box.
|
|
To use the property on a Chart that was previously created with the Chart Editor, simply call the function. For example: |