Represent Data with Shape, Color, Size
| Change Chart Element Appearance, to use static VisualFrame objects. |
You can create a basic two-dimensional representation of data with just a GraphElement object. To represent additional dimensions by using other visual attributes of elements, create a VisualFrame.
To understand how to use a VisualFrame, consider the script below:
dataset = [["State","Quantity","Total"],["NJ",200,2500],["NY",300,1500]];
graph = new EGraph();
var elem = new PointElement("State", "Quantity");
graph.addElement(elem);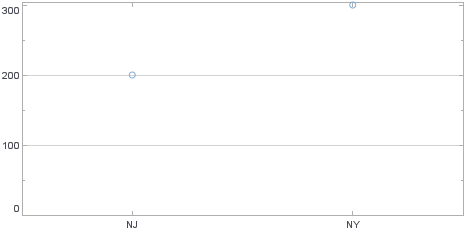
Script that modifies the graph or dataset properties should be placed on the Chart component itself. See Add Component Script for more information. This script has access to the Chart data and Chart API methods. Scripted Charts are not good candidates for user-modification, so you should deselect ‘Enable Ad Hoc Editing’ in the Chart Properties dialog box.
|
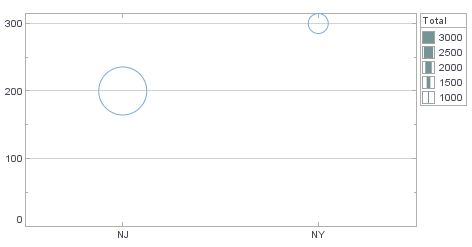
This creates a basic Point (scatter) Chart displaying the dimensions ‘State’ and ‘Quantity’. If you want to additionally represent the dimension ‘Total’ with the element size, use a VisualFrame such as the LinearSizeFrame. Follow these steps:
-
Create a new
LinearSizeFrameobject, and specify the field containing the data that will determine the element sizes.var frame = new LinearSizeFrame(); frame.setField("Total");A
VisualFrameobject such asLinearSizeFramecontains a mapping between data values and physical attributes. Therefore, you need a Scale to specify the mapping’s scaling. -
Create a new LinearScale object, and assign the scale properties. (See Change Chart Scaling for more information.)
var scale = new LinearScale(); scale.setFields("Total"); scale.setMax(3000); scale.setMin(1000); -
Assign the new
Scaleto theVisualFrameobject:frame.setScale(scale); -
Assign the
VisualFrameobject to the GraphElement object:elem.setSizeFrame(frame);The point sizes now represent the data values contained in the ‘Total’ field.