axis.format
Sets the format for dimension or measure axis labels. The xAxis, yAxis, and y2Axis properties can be used as a shortcut. The available formats are shown below:
-
Chart.DATE_FORMATfor date display -
Chart.DECIMAL_FORMATfor number display -
Chart.MESSAGE_FORMATfor text display -
Chart.PERCENT_FORMATfor fraction display -
Chart.CURRENCY_FORMATfor locale-adapting currency display
For the Date, Decimal, and Message formats, optionally specify the format and mask as items in an array. See Add Data Format in Visualize Your Data for more information about Dashboard formatting.
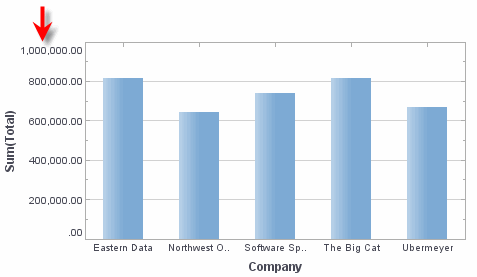
Example (Text)
Chart1.axis['Company'].format = [Chart.MESSAGE_FORMAT,"{0} Inc."]
Chart1.axis['Company'].rotation = 30;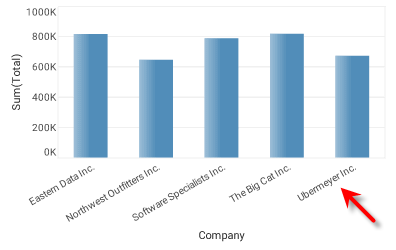
|
Either syntax below can be used in component script: For onInit/onRefresh scripts, and for component and property scripts on other components, the second (qualified) form is required. |