IntervalElement.setStackNegative(Boolean)
Specifies whether negative and positive values stack independently on opposite sides of the axis, or whether stacking is cumulative (i.e., determined arithmetically). Note: There is no corresponding “getter” function.
Parameters
- Boolean
-
true: stack positive and negative values independently
false: stack positive and negative values arithmetically
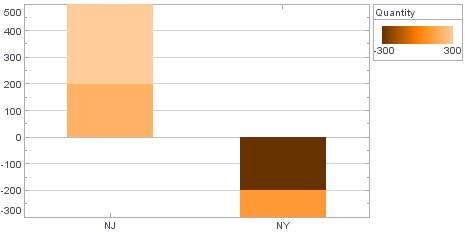
Example
Chart Component Script
dataset = [["State","Quantity"],["NJ",200],["NJ",300],["NY",-300],["NY",100]]; (1)
graph = new EGraph();
var elem = new IntervalElement("State", "Quantity"); (2)
var scale = new LinearScale("Quantity");
var frame = new HeatColorFrame();
frame.setField("Quantity");
elem.setColorFrame(frame);
elem.setStackGroup(true);
elem.setStackNegative(false); (3)
elem.setCollisionModifier(GraphElement.STACK_SYMMETRIC);
graph.addElement(elem); (4)| 1 | See dataset to use a data block instead of an array literal. |
| 2 | Create the IntervalElement object. |
| 3 | Use setStackNegative to stack arithmetically. |
| 4 | Use EGraph.addElement(elem) to add the IntervalElement to the Chart. |
Script that modifies the graph or dataset properties should be placed on the Chart component itself. See Add Component Script for more information. This script has access to the Chart data and Chart API methods. Scripted Charts are not good candidates for user-modification, so you should deselect ‘Enable Ad Hoc Editing’ in the Chart Properties dialog box.
|
|
To change the property on a Chart that was previously created with the Chart Editor, use “getter” methods such as EGraph.getElement(index) ① to obtain a handle to the desired GraphElement object. For example: |