EGraph.addForm(form)
Adds the specified GraphForm to the chart. See Chart Annotation for available forms. The inverse operations are EGraph.removeForm(idx) and EGraph.clearForms().
Parameter
- form
-
a GraphForm object
Example
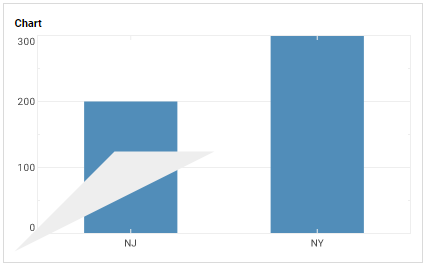
Chart Component Script
dataset = [["State", "Quantity"], ["NJ", 200], ["NY", 300]]; (1)
graph = new EGraph();
var elem = new IntervalElement("State", "Quantity");
var form = new LineForm(); (2)
form.addPoint(new java.awt.Point(0,0));
form.addPoint(new java.awt.Point(100,100));
form.addPoint(new java.awt.Point(200,100));
form.setFill(true);
graph.addForm(form); (3)
graph.addElement(elem);| 1 | See dataset to use a data block instead of an array literal. |
| 2 | Create the GraphForm object. |
| 3 | Use addForm to add the GraphForm to the Chart. |
Script that modifies the graph or dataset properties should be placed on the Chart component itself. See Add Component Script for more information. This script has access to the Chart data and Chart API methods. Scripted Charts are not good candidates for user-modification, so you should deselect ‘Enable Ad Hoc Editing’ in the Chart Properties dialog box.
|
|
To change the property on a Chart that was previously created with the Chart Editor, simply add the GraphForm ① to the chart without defining a new Chart element. |