Scale.setScaleOption(value)
Specifies a scaling option for the default scaling. The corresponding “getter” function is getScaleOption().
The Scale.TICKS option uses the maximum and minimum tick values (i.e., rounded numbers) rather than the maximum and minimum data values. The Scale.ZERO option uses zero as the minimum rather than the minimum data value (if positive). To combine multiple options, use the pipe (“or”) operator:
qscale.setScaleOption(Scale.ZERO | Scale.TICKS);Parameter
- value
-
Scale.RAW(no modification)
Scale.NO_NULL(remove NULL-data gaps in scale)
Scale.TICKS(use ticks in scale range calculation)
Scale.ZERO(use zero in scale range)
Example
Chart Component Script
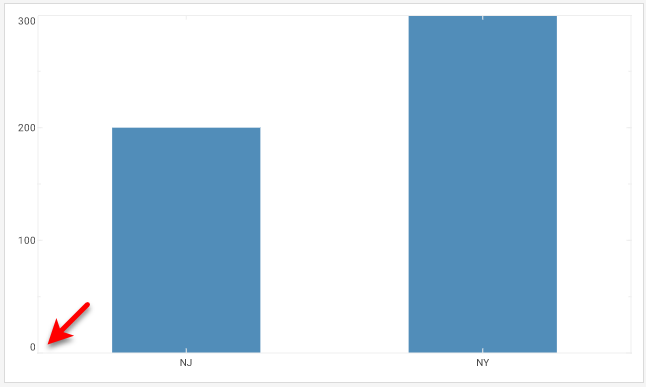
dataset = [["State", "Quantity"], ["NJ", 200], ["NY", 300]]; (1)
graph = new EGraph();
var elem = new IntervalElement("State", "Quantity");
var sscale = new CategoricalScale("State"); (2)
var qscale = new LinearScale("Quantity"); (2)
var coord = new RectCoord(sscale,qscale); (3)
qscale.setScaleOption(Scale.ZERO); (4)
graph.setCoordinate(coord); (5)
graph.addElement(elem);| 1 | See dataset to use a data block instead of an array literal. |
| 2 | Create the Scale objects. |
| 3 | Use the Scale to create a new Coordinate. |
| 4 | Use setScaleOption to use zero in scale range. |
| 5 | Use EGraph.setCoordinate(coord) to add the Coordinate to the Chart. |
Script that modifies the graph or dataset properties should be placed on the Chart component itself. See Add Component Script for more information. This script has access to the Chart data and Chart API methods. Scripted Charts are not good candidates for user-modification, so you should deselect ‘Enable Ad Hoc Editing’ in the Chart Properties dialog box.
|