GraphQL Query
To create a new data set from an existing GraphQL connection, follow the steps below:
-
If you have not yet configured the database connection, see GraphQL. Then proceed with the steps below.
If you see the ‘Create Visualization’ dialog box, press the ‘Close’ button
 to continue with the steps below (recommended).
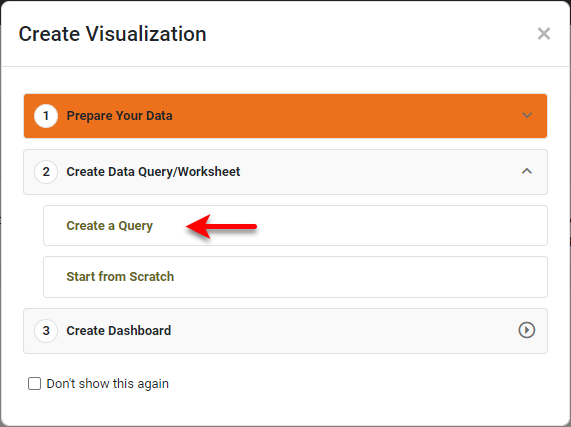
You can also press Create a Query to open the ‘New Data Worksheet’ dialog box, where you can select the query you wish to create. This allows you to skip the ‘Add’ button
 and proceed to the next steps.
 -
Open the Data Worksheet that will contain the data. (See Create a Data Worksheet or Edit a Data Worksheet.)
-
Press the ‘Add’ button
, and select ‘GraphQL Query’  . This opens the ‘GraphQL Query’ dialog box.
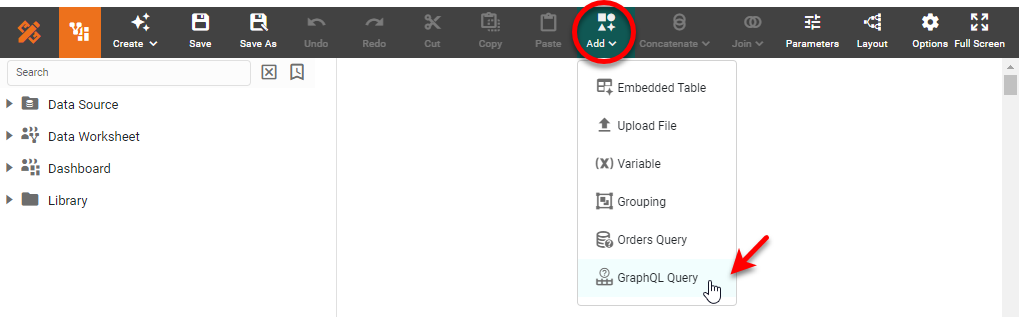
-
Enter the desired GraphQL query in the ‘Query’ field. See the GraphQL site for more information about syntax and usage. An example of a simple query (without variables or pagination) is shown below:
boards {
    activity_logs {
        id
        event
        data
    }
}
If the query uses variables or passes parameters such as limits or filters to an object being referenced, then use the query keyword as follows:
query($pageNum: Int) { boards { activity_logs(limit: 3, page: $pageNum) { id event data } } } -
Optional: In the ‘Variables’ field, enter any variables and values that you want to be substituted within the query. This is primarily useful when a value is used several times within the query. For example, if you use
$variableNamein the query, you can add{"variableName": "value"}in the ‘Variables’ field to perform the substitution ofvalueforvariableName. -
Optional: Check ‘Use Pagination’ if you want to paginate the result set. Enter the ‘Pagination Variable’ (e.g.,
pageNum). This variable’s appearance in the query will be substituted with the actual page number being requested.Enter as the ‘Pagination JSON Path’ the expression to evaluate to determine when retrieval is complete. For example, consider the query above. If ‘Pagination Variable’ is
pageNum, then the above request is made withpageNumreplaced in turn by the values 1, 2, 3, 4, and so on. Each individual request returns three results (limit: 3). The ‘Pagination JSON Path’ in this case is$.data.boards[0].activity_logs.length(), which is evaluated on every response. When this expression returns a length of 0 for theactivity_logsarray, the process stops. -
For ‘Request Type’, select ‘GET’ or ‘POST’. For a GraphQL data source, ‘POST’ is the usual method. In this case, query and variable data is sent in the body of the request, so the actual request will be formed as shown below:
POST https://api.monday.com/v2
{"query":"boards{activity_logs{id}}","variables":{pageNum:1}}
Note that if you use the ‘GET’ method, parameters will be embedded in the query parameter part of the URL, which may not be desirable:
GET https://api.monday.com/v2?query=boards{activity_logs{id}}&variables={pageNum:1}} -
Enter the desired ‘JSON Path’. See JSONPath - XPath for JSON for information about the JSON Path syntax.
-
Optional: Select ‘Expand Arrays’ to expand a record that contains an array into multiple records.
Example: Expand Arrays…
Consider the following JSON:
{
    "id": 1,
    "items": [
        {
            "id": 1,
            "name": "Object 1",
            "list1": [ "Item 1.1.1", "Item 1.1.2" ],
            "list2": [ "Item 1.2.1", "Item 1.2.2" ]
        },
        {
            "id": 2,
            "name": "Object 2",
            "list1": [ "Item 2.1.1", "Item 2.1.2" ],
            "list2": [ "Item 2.2.1", "Item 2.2.2" ]
        }
    ]
}
If ‘Expand Arrays’ and ‘Top Level Only’ are both enabled (and ‘JSON Path’ is
$or blank), the top level of the array will be expanded into its individual items.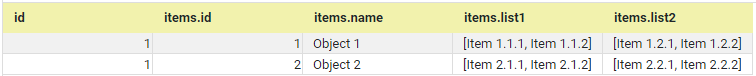
If ‘Top Level Only’ is disabled, all arrays will be fully expanded in parallel, as shown below:
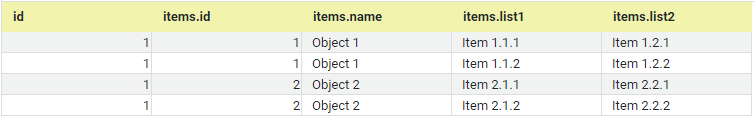
To selectively expand only certain portions of the result, deselect the ‘Top Level Only’ option, and use the ‘Expanded Array Path’ field to specify the portion of the JSON path on which arrays should be expanded. For example, set ‘Expanded Array Path’ to
items.list1to expand theitemsandlist1arrays. (The top level array is always expanded.)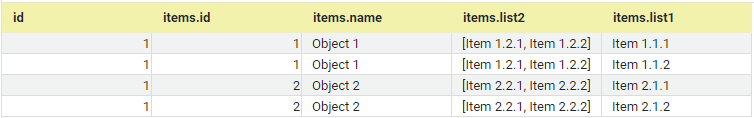
-
Press OK. This creates a new data block in the Data Worksheet.
-
Optional: Right-click on the data block, and select ‘Properties’ from the context menu. Note: You can also access menu options from the ‘More’ button (
 ) in the mini-toolbar. This opens the ‘Table Properties’ panel. In the ‘Name’ field, enter a name for the data block, and press ‘OK’. (See Modify a Column for information about how to rename columns.
Names must be unique without respect to case (e.g., "num1" is the same name as "Num1"). -
Press the ‘Save’ button
 in the toolbar to save the Data Worksheet.
You can now do pipeline operations on this data, as described in Prepare Your Data, or you can proceed to create Dashboards based on this Data Worksheet. See Visualize Your Data for information about how to construct a Dashboard.