DataSet.getRowCount()
|
Returns the number of rows in the DataSet (including the header row).
Example
Chart Component Script
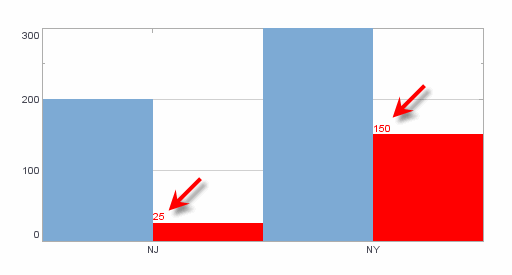
 // Create a chart with two datasets:
dataset = [["State", "Total", "Profit"],["NJ", 200, 25],["NY", 300, 150]]; (1)
graph = new EGraph();
var elem1 = new IntervalElement("State", "Total");
var elem2 = new IntervalElement("State", "Profit");
var frame = new StaticColorFrame(java.awt.Color.red);
elem2.setColorFrame(frame);
graph.addElement(elem1);
graph.addElement(elem2);

// Loop through the rows of the second dataset (Profit),
// and place labels on the bars.
for (var i=0; i<dataset.getRowCount(); i++) { (2)
  var form = new LabelForm();
  form.setLabel(dataset.getData(2,i));
  form.setValues([dataset.getData(0,i), dataset.getData(2,i)]);
  var spec = new TextSpec();
  spec.setColor(java.awt.Color.red)
  form.setTextSpec(spec)
  graph.addForm(form)
}| 1 | See dataset to use a data block instead of an array literal. |
| 2 | Use getRowCount() to get the number of rows. |
Script that modifies the graph or dataset properties should be placed on the Chart component itself. See Add Component Script for more information. This script has access to the Chart data and Chart API methods. Scripted Charts are not good candidates for user-modification, so you should deselect ‘Enable Ad Hoc Editing’ in the Chart Properties dialog box.
|