RectForm.setBottomRightPoint(value)
Specifies the pixel location (integer values) or proportional location (fractional values) defining the bottom right corner of the rectangle. (Positive values specify distance from left/bottom. Negative values specify distance from right/top.) The corresponding “getter” function is getBottomRightPoint().
Parameter
- value
-
a subclass of java.awt.geom.Point2D
(e.g., java.awt.Point for pixels, java.awt.geom.Point2D.Double for proportion)
Example
Chart Component Script
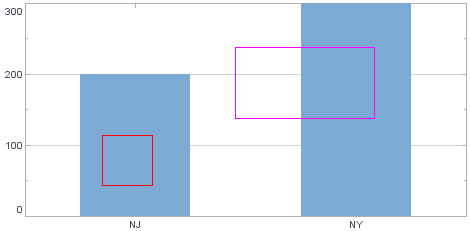
dataset = [["State", "Quantity"], ["NJ", 200], ["NY", 300]]; (1)
graph = new EGraph();
var elem = new IntervalElement("State", "Quantity");
var rect1 = new RectForm(); (2)
var rect2 = new RectForm(); (2)
rect1.setTopLeftPoint(new java.awt.Point(100, 100));
rect1.setBottomRightPoint(new java.awt.Point(150, 50)); (3)
rect1.setColor(java.awt.Color(0xff0000));
rect2.setTopLeftPoint(new java.awt.geom.Point2D.Double(.5,.8));
rect2.setBottomRightPoint(new java.awt.geom.Point2D.Double(.8,.5)); (4)
rect2.setColor(java.awt.Color(0xff00ff));
graph.addForm(rect1); (5)
graph.addForm(rect2); (5)
graph.addElement(elem);| 1 | See dataset to use a data block instead of an array literal. |
| 2 | Create the RectForm object. |
| 3 | Use setBottomRightPoint() to set rect1 points in pixels. |
| 4 | Use setBottomRightPoint() to set rect2 points proportionally. |
| 5 | Use EGraph.addForm(form) to add the GraphForm to the Chart. |
Script that modifies the graph or dataset properties should be placed on the Chart component itself. See Add Component Script for more information. This script has access to the Chart data and Chart API methods. Scripted Charts are not good candidates for user-modification, so you should deselect ‘Enable Ad Hoc Editing’ in the Chart Properties dialog box.
|
|
To change the property on a Chart that was previously created with the Chart Editor, you do not need to add a Chart element. For example: |