drillMembers
| Property is read-only. It cannot be set in script. |
|
Returns an array of the levels at which the user has made a selection. The array includes all levels from the top level to one level below the current selection. (The top level is included even when no selection is made.)
| drillMembers does not apply to Selection Lists. |
For example, consider a three-level Selection Tree hierarchy: .
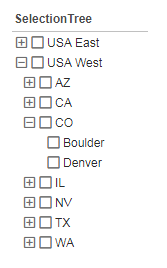
If the user makes a selection at the level of region, drillMembers returns the array ['Region','State']. If the user makes a selection at the level of state or city, drillMembers returns the array ['Region','State','City']. This array is useful for displaying multiple geographical levels on a map, as shown in the example below.
Example
Follow the steps below to create a dynamic multi-level map drill:
-
Create a new Dashboard based on the ‘Sales Explore’ Data Worksheet. (See Create a New Dashboard.)
The 'Sales Explore' Data Worksheet can be found in . You may need to download the examples.zip file from GitHub into your environment. (This requires access to Enterprise Manager.) See Import and Export Assets for instructions on how to import. -
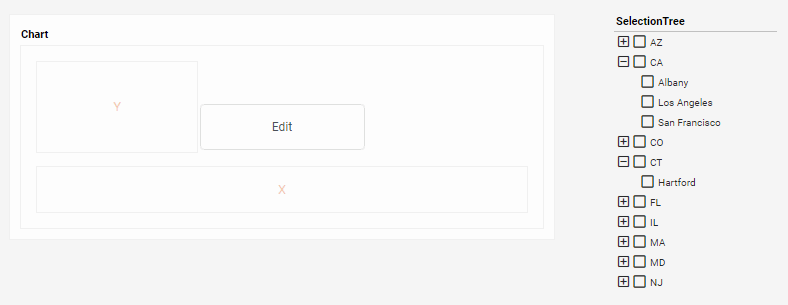
From the Toolbox panel, drag a Chart component into the Dashboard. Resize the Chart as desired.
-
From the Toolbox panel, drag a Selection Tree component into the Dashboard.
-
Add a two-level geographical hierarchy to the Selection Tree. Follow the steps below:
-
Expand the ‘Sales’ data block in the Toolbox panel.
-
Drag the ‘State’ field from the data block onto the Selection Tree. This adds the ‘State’ values to the tree.
-
Drag the ‘City’ field from the data block onto the Selection Tree. This adds the ‘City’ values to the tree.
-
Resize the Selection Tree so that it can display a reasonable number of options.
-
-
Press the ‘Edit’ button
 on the Chart to open the Visualization Recommender. Press the ‘Full Editor’ button at the top right of the Recommender to bypass the Recommender and open the Chart Editor.
 -
Press the ‘Select Chart Style’ button
 in the Data panel, and choose the ‘Map’ chart type.
 -
In the Data Source panel, right click on the ‘State’ field, and select ‘Set Geographic’.
-
In the Data Source panel, right click on the ‘City’ field, and select ‘Set Geographic’.
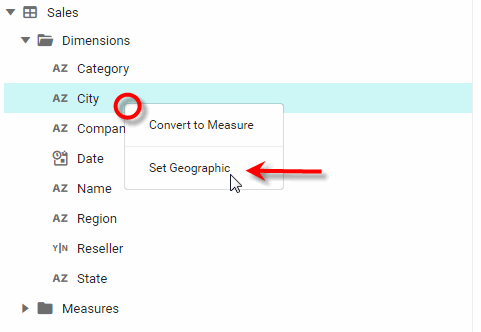
A red question mark indicates that not all cities in the ‘City’ field of this example have mappings. -
From the Data Source panel of the Chart Editor, drag the ‘Total’ measure to the ‘Color’ region in the Visual panel.
-
From the Data Source panel of the Chart Editor, drag the ‘State’ dimension to the ‘Geographic’ region in the Data panel.
-
Configure the Chart to adapt the geographical level based on the user’s selection in the Selection Tree. To do this, follow the steps below:
-
Press the ‘Value Type’ button
 button next to the ‘State’ dimension in the Data panel. In the pop-up menu, select the ‘Expression’ option.
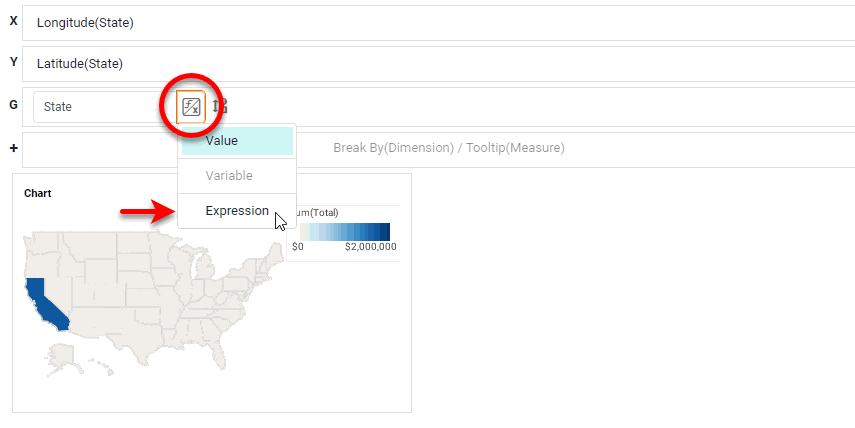
-
Press the ‘Edit Formula’ button
 to open the Script Editor.
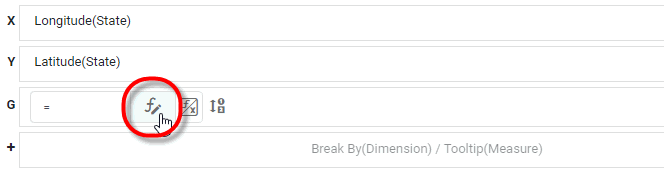
-
In the top-left panel of the Script Editor, expand the
SelectionTree1node, and clickdrillMembers(notdrillMember). This adds theSelectionTree1.drillMembersproperty in the editing area.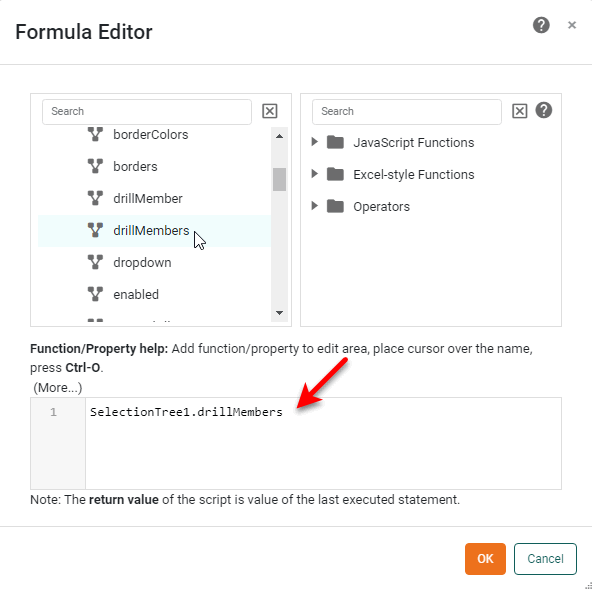
If the user makes no selection in the Selection Tree, the
drillMembersproperty returns the array['State'], which displays the ‘Total’ measure on a state-basis. If the user selects one or more states or cities in the Selection Tree,drillMembersreturns the array['State','City'], which displays the ‘Total’ measure on a city-basis. -
Press OK to close the Script Editor. The output of
SelectionTree1.drillMembersis now assigned to the Chart Geographical binding.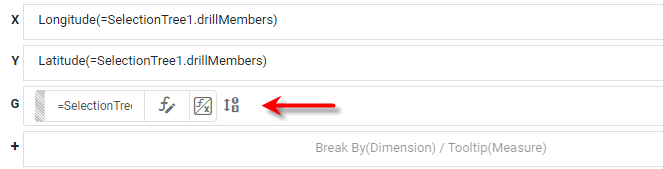
-
-
Verify that the map adapts to the user’s selections:
-
Press the ‘Clear Selection’ button
 in the Selection Tree to remove any existing selections. Observe that the map represents the measure on a state level, the top level of the Selection Tree hierarchy.
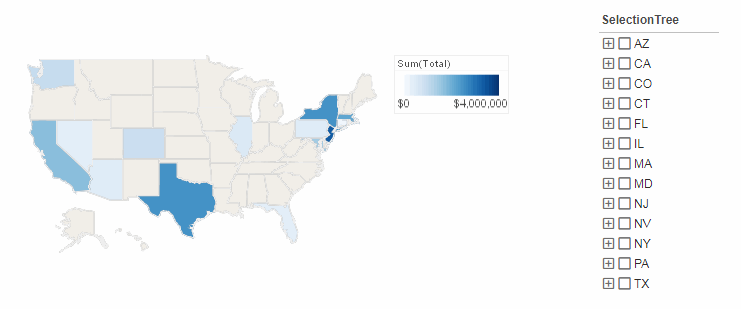
-
Select the ‘CA’ option in the Selection Tree. Observe that the Selection Tree filters the map to display only data from California. In addition, the
drillMembersproperty changes the geographical binding to represent the ‘City’ dimension, and the measure is now displayed at the city-level.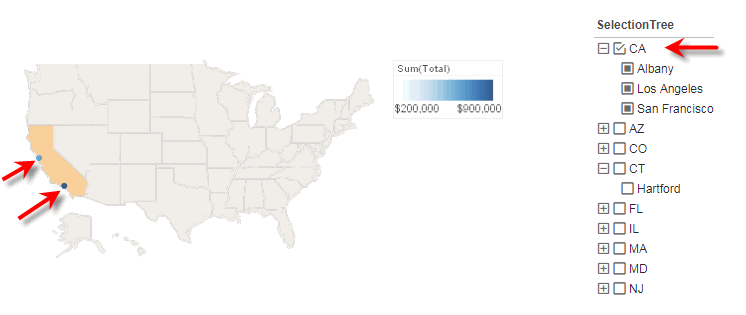
-
To automatically zoom a map to display only the regions that the user selects, see the example for Coordinate.setFullMap(boolean).
|
Either syntax below can be used in component script: For onInit/onRefresh scripts, and for component and property scripts on other components, the second (qualified) form is required. |