Compare Data by Date
| These features are available to both designers and end-users. |
Charts and Crosstabs provide an easy way to compare data across different date ranges. For example:
-
Compare this quarter’s sales to the previous two quarters
-
Compare this January’s sales to each of the past five January’s sales
-
Compare each day last week to each day this week, showing percent change
To perform such date comparisons in a Chart or Crosstab, follow the steps below.
| The Chart or Crosstab must contain a Date-type field. Date comparisons use color to distinguish date groups unless the original chart already uses color; in this case, the axis is used to distinguish date groups. |
-
Press the ‘More’ button (
 ) in the top corner of Chart or Crosstab, and select ‘Date Comparison’.
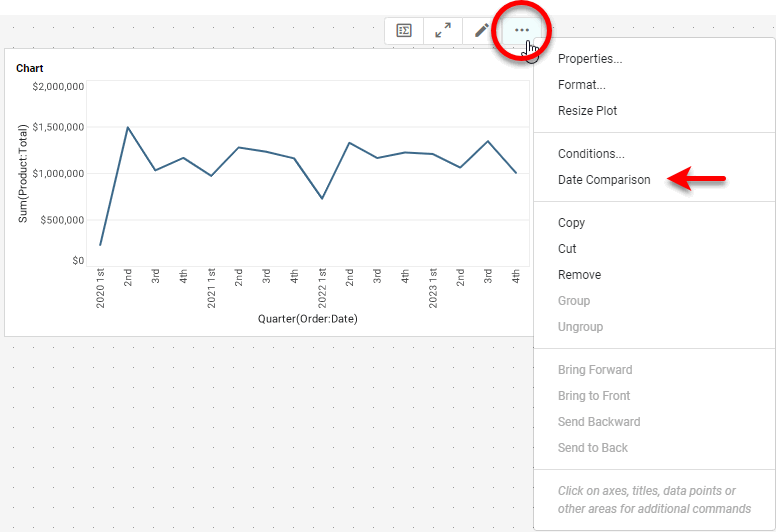
This opens the ‘Date Comparison’ dialog box.
-
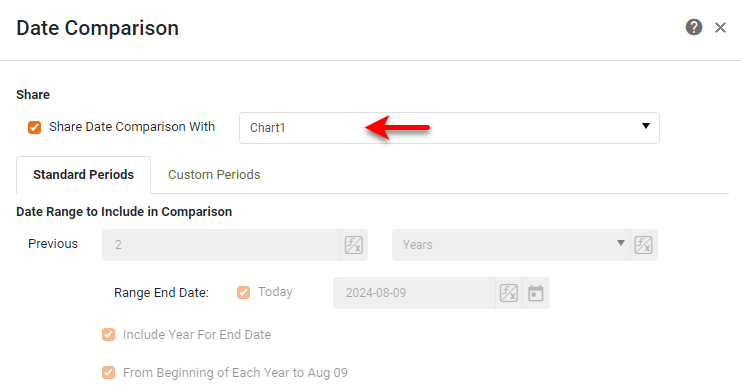
Optional: To apply an existing date comparison from another Chart or Crosstab in the Dashboard, enable the ‘Share Date Comparison With’ option, and choose the component from which to share the date comparison. Then press OK to exit the dialog box.
-
Under Date Range to Include in Comparison, set the span of time to consider in the comparison. You can do this by specifying either a number of previous standard periods to compare (e.g., “compare previous 5 years”) or by specifying a set of custom periods to compare (e.g., “compare Jan. 5, 2019 through Feb. 10, 2020 with Nov. 5, 2019 through Dec 10, 2020”). Expand the sections below for more details on these two approaches.
Compare standard periods…
-
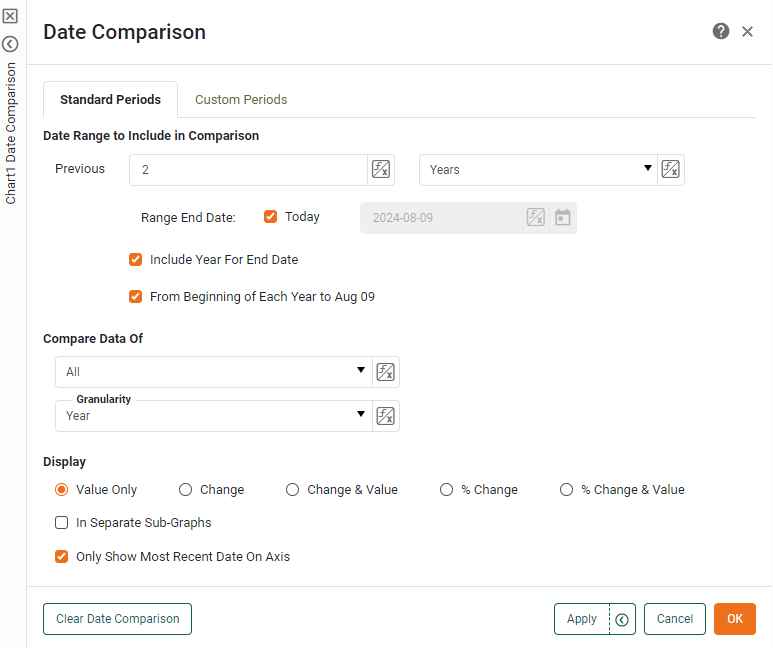
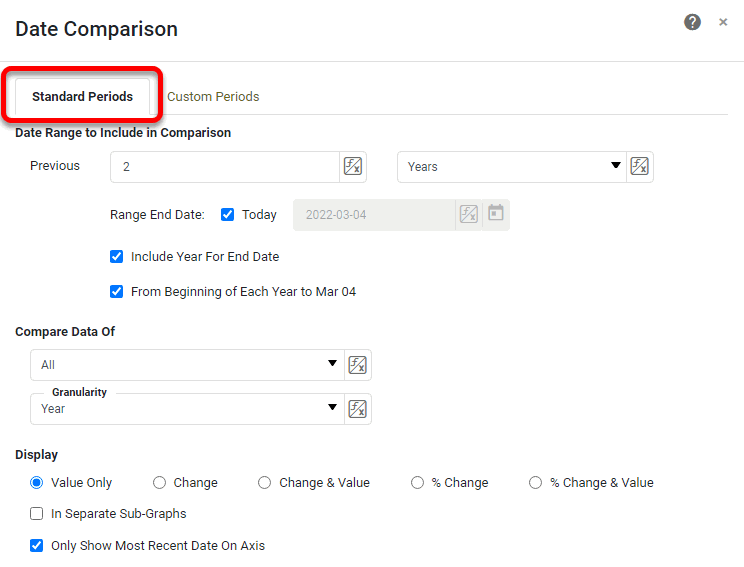
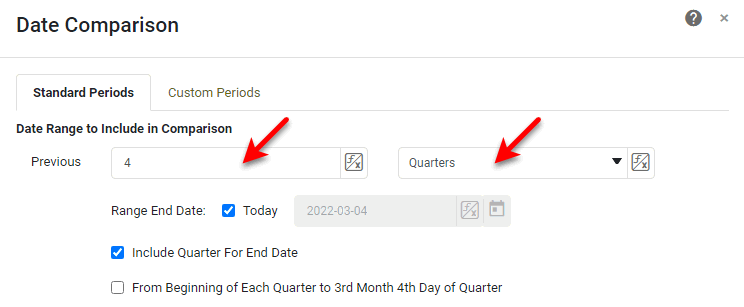
Select the ‘Standard Periods’ tab if not already selected.
-
Enter the number of past periods to compare and the type of period. For example, enter ‘4’ and select ‘Quarter’ to compare data from the past four quarters.
You can also use Form components to set the number and period by pressing the ‘Value Type’ button  and selecting the ‘Variable’ or Expression’ option. See Dynamically Set Properties for more information.
-
Specify the ‘Range End Date’. This is the date that determines the most recent data to include in the comparison. Select ‘Today’ to use the current date as the cut-off, or deselect ‘Today’ and enter an arbitrary date as the cut-off. Optional: To include the end date period (the period in which the selected ‘Range End Date’ occurs) in the comparison, enable the ‘Include Year/Quarter/Month/Week For End Date’ option. Otherwise, the comparison will include data up to, but not including, the end date period.
-
Optional: Select ‘From Beginning of Each Year/Quarter/Month/Week to … of Year/Quarter/Month/Week ’ to include data only up to the ‘Range End Date’ (i.e., the same number of days) for all selected periods. For example, if the ‘Range End Date’ is Jan 21, and you select “previous four quarters” and enable ‘From Beginning of Each Quarter to 1st Month 21st Day of Quarter’, the current and previous four quarters will each only include the first 20 days of the quarter.
Compare custom periods…
-
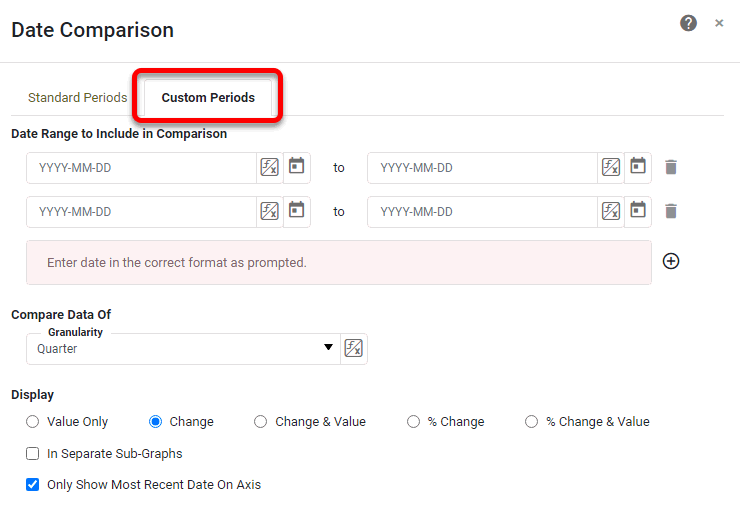
Select the Custom Periods tab if not already selected.
-
Enter the desired period ranges by typing the dates in the indicated format or by pressing the ‘Select a Date’ button
 .
.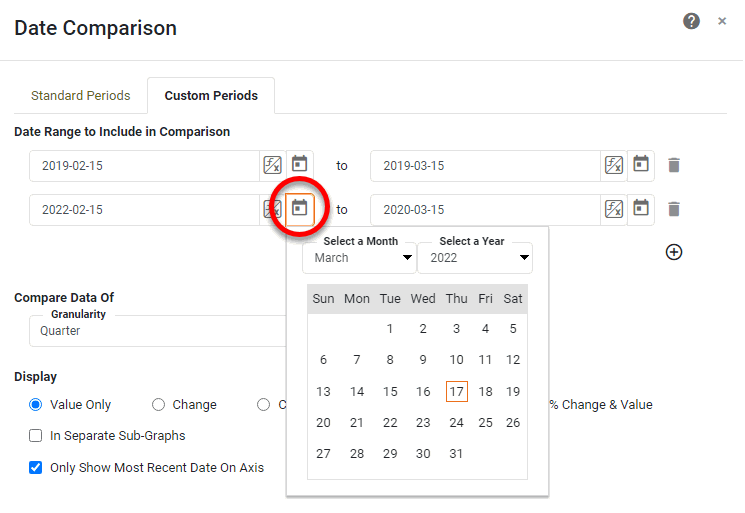
You must specify at least two ranges. To add additional ranges, press the ‘Add’ button
 . To remove a range, press the ‘Remove’ button
  next to the range.
You can also use Form components to set the dates by pressing the ‘Value Type’ button and selecting the ‘Variable’ or Expression’ option. See Dynamically Set Properties for more information.
-
-
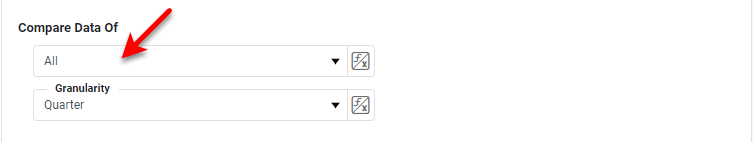
Under Compare Data Of, use the menus to set the desired comparison. You can perform the following three types of comparisons:
Compare all periods within the date range…
-
To compare all periods within the date range (e.g., all quarters, all months, etc.), select ‘All’ from the left menu. From the ‘Granularity’ menu, select the periods that you want to display on the Chart.
You can also use Form components to set these options by pressing the ‘Value Type’ button and selecting the ‘Variable’ or Expression’ option. See Dynamically Set Properties for more information.
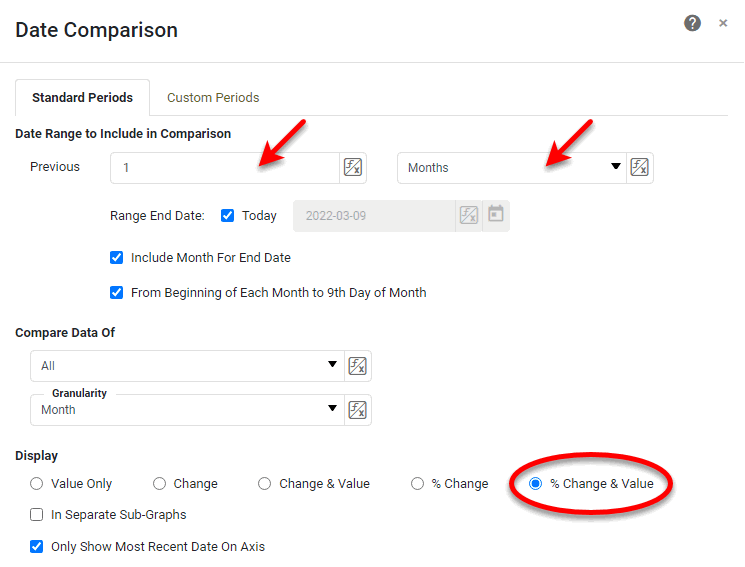
Example 1. Compare this month to date against last month, showing percent changeConfigure the options as follows:
The resulting date comparison is shown below. Hover the pointer over ‘Compare’ button
 in the top left or right corner of the Chart or Crosstab to display the comparison details. Press the ‘Compare’ button to reopen the ‘Date Comparison’ dialog box.
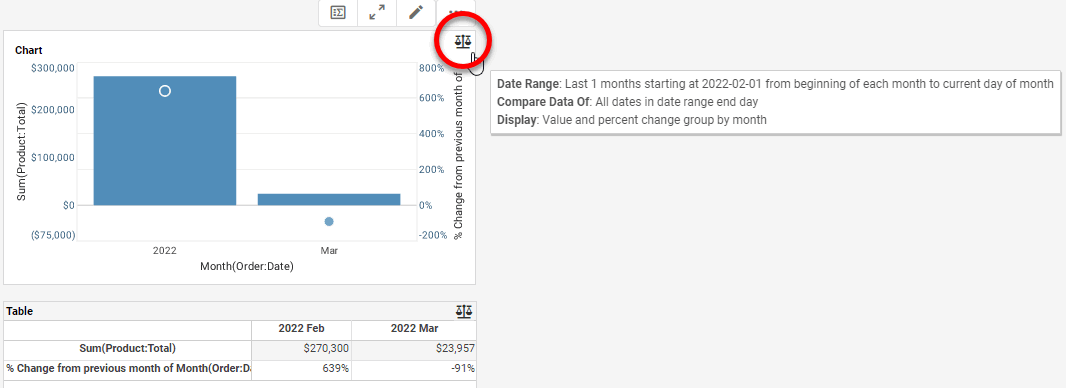
The Chart and Crosstab compare the past month and present month (to date), and provides the percent change as well as the respective values.
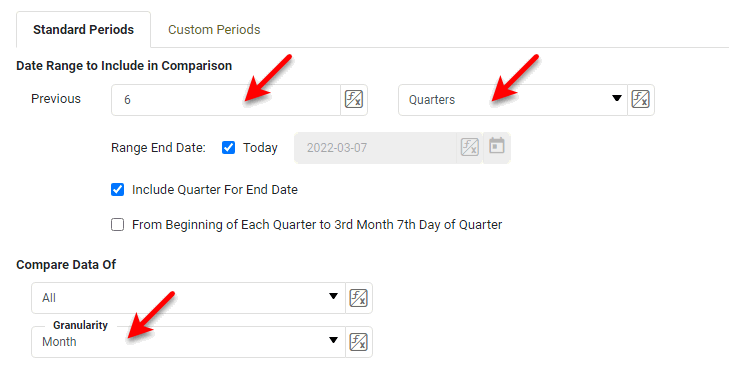
Example 2. Compare the past six quarters, broken out by monthConfigure options as follows:
The resulting date comparison is shown below. Hover the pointer over ‘Compare’ button
in the top left or right corner of the Chart or Crosstab to display the comparison details. Press the ‘Compare’ button to reopen the ‘Date Comparison’ dialog box.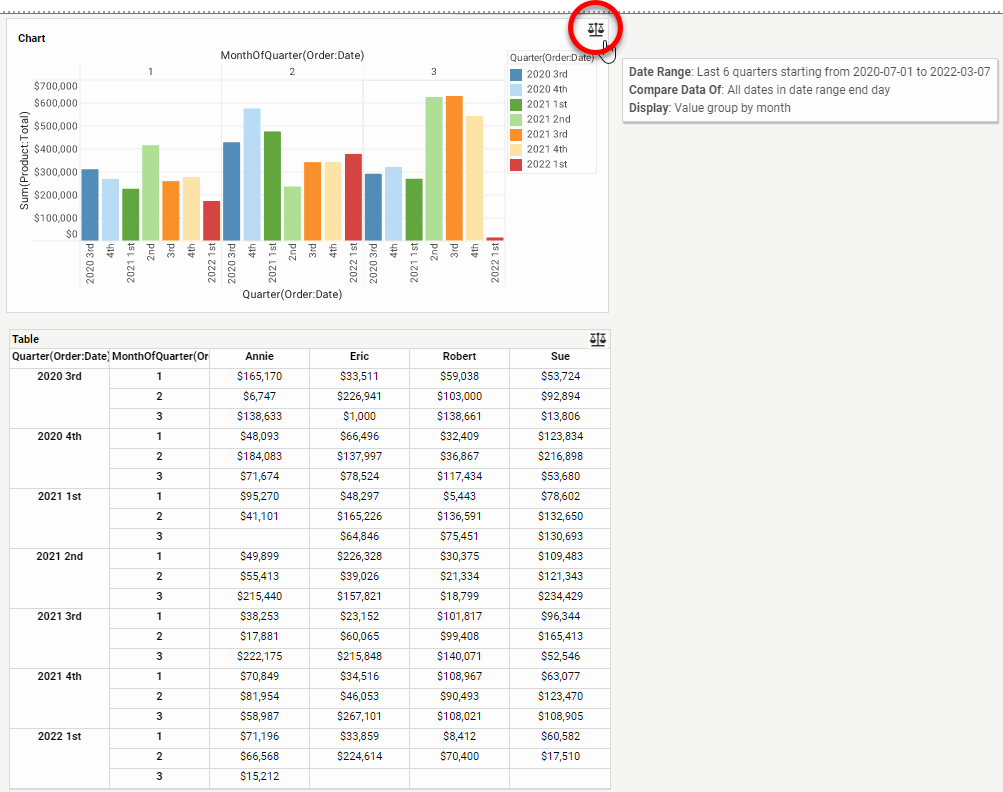
The data on the Chart and Crosstab includes the past six quarters, and provide a comparison of each quarter broken out by month of quarter (month 1, 2, or 3).
Compare the single same period across the date range…
To compare the single same period across the date range (e.g., same month of each year, same week of each quarter, etc.), select ‘Same Month’, ‘Same Week’, or ‘Same Day’ from the left menu.
The particular period being compared (e.g., the particular month) is determined by the end date: Select ‘Use Range End Date’ to compare the same month/week/day as the selected ‘Range End Date’ above, or deselect ‘Use Range End Date’ and enter an arbitrary date using the calendar widget. From the ‘Granularity’ menu, select the periods that you want to display on the Chart.
You can also use Form components to set these options by pressing the ‘Value Type’ button and selecting the ‘Variable’ or ‘Expression’ option. See Dynamically Set Properties for more information.
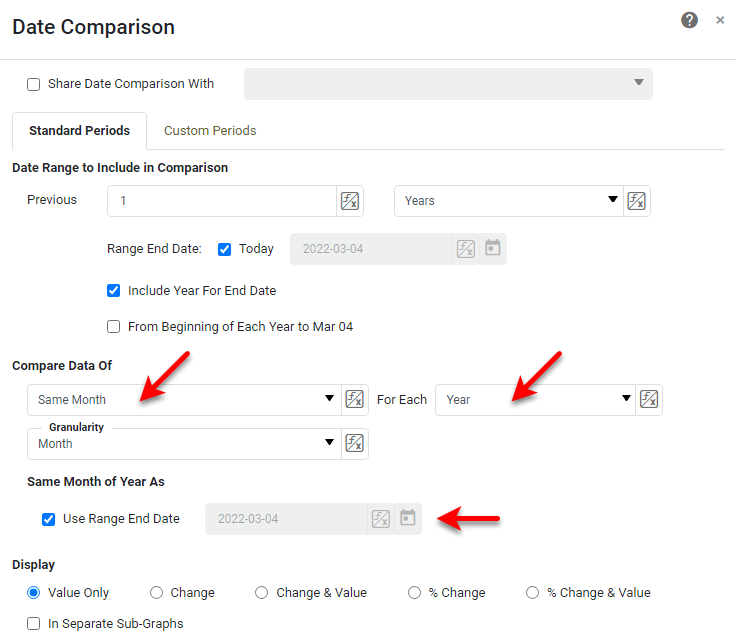
Example 3. Compare this month this year (to date) against this month last year.Configure the options as follows:
The resulting date comparison is shown below. Hover the pointer over ‘Compare’ button
in the top left or right corner of the Chart or Crosstab to display the comparison details. Press the ‘Compare’ button to reopen the ‘Date Comparison’ dialog box.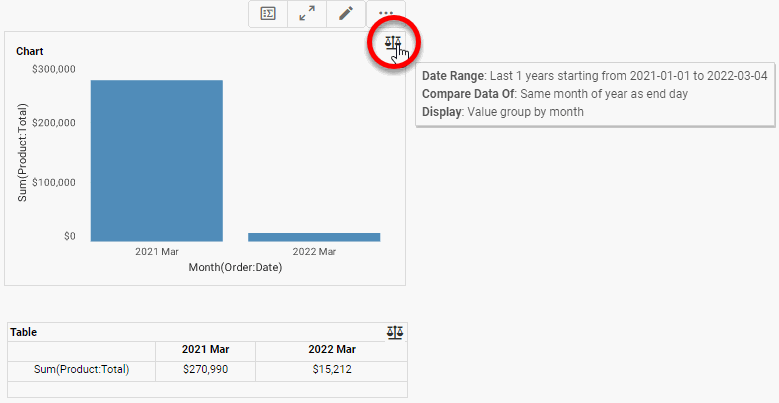
The Chart and Crosstab compare the current month of the current and previous year.
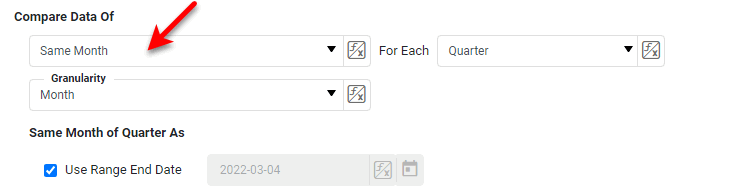
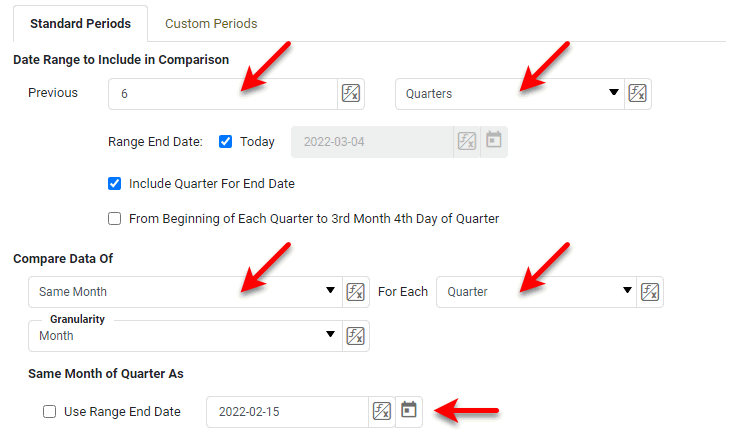
Example 4. Compare the second month of each quarter for the past six quarters.Configure the options as follows:
The resulting date comparison is shown below. Hover the pointer over ‘Compare’ button
in the top left or right corner of the Chart or Crosstab to display the comparison details. Press the ‘Compare’ button to reopen the ‘Date Comparison’ dialog box.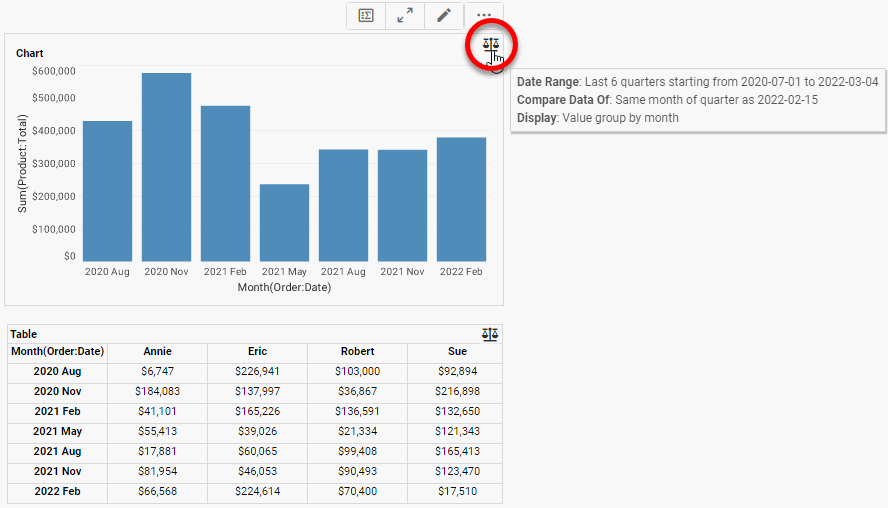
The data on the Chart and Crosstab includes the past six quarters, and provides a comparison of the second month of each quarter (e.g., Feb, May, Aug, Nov).
Compare the same period “to date” across the date range…
To compare the same period “to date” across the date range (e.g., same month of each year up to the 15th day of the month), select ‘Quarter To Date’, ‘Month To Date’, or ‘Week To Date’ from the left menu. Select ‘Use Range End Date’ to compare each month/week/day up until the ‘Range End Date’ date (specified above) within that period (e.g., the 24th day of the quarter), or deselect ‘Use Range End Date’ and enter an arbitrary date using the calendar widget. Check the ‘Inclusive’ option to include the specified “as of” date in the range. From the ‘Granularity’ menu, select the periods that you want to display on the Chart.
You can also use Form components to set these options by pressing the ‘Value Type’ button and selecting the ‘Variable’ or Expression’ option. See Dynamically Set Properties for more information.
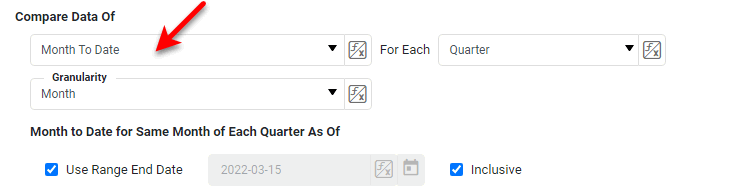
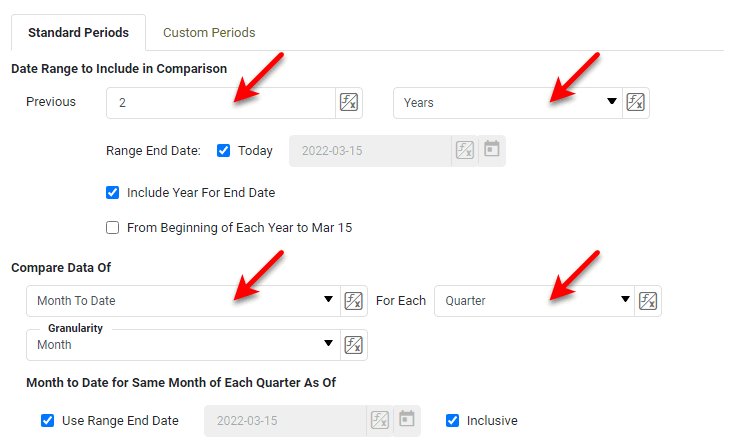
Example 5. Compare month-to-date for each quarter in the past two years.Configure the options as follows:
The resulting date comparison is shown below. Hover the pointer over ‘Compare’ button
in the top left or right corner of the Chart or Crosstab to display the comparison details. Press the ‘Compare’ button to reopen the ‘Date Comparison’ dialog box.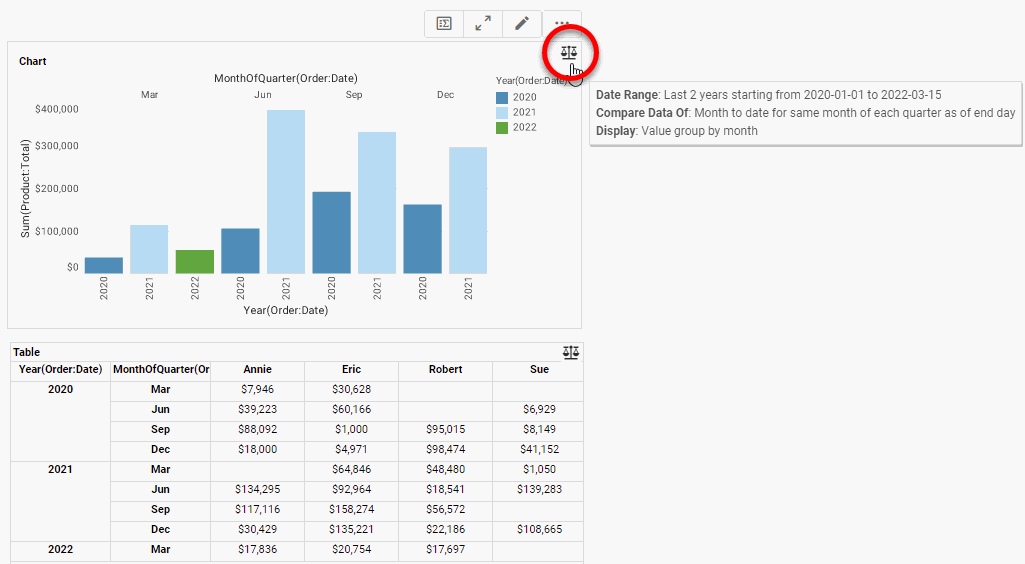
The data on the Chart and Crosstab includes the past two years, and provides a comparison of the current month (in this case the third month) of each quarter up to today’s date (e.g., the 8th day of the month).
-
-
Under Display, choose a way to display the comparisons on the Chart:
-
Value displays the aggregated values for all groups on the chart.
-
Change displays the change of each group from the previous group.
-
% Change display the change of each group from the previous group as a percentage.
-
Change & Value and % Change & Value combine both representations on the Chart.
-
-
Optional: Select ‘In Separate Sub-Graphs’ to break the comparison across separate axes on the Chart.
When ‘In Separate Sub-Graphs’ is enabled, the ‘% Change & Value’ representation is a line; otherwise, the representation is a point. -
Optional: Select ‘Only Show Most Recent Date On Axis Label’ to display only the more recent of the compared dates on the X-axis. This can sometimes help relieve label crowding on the axis.
-
Press OK to apply the specified comparison and exit the dialog box, or press Apply to view the comparison on the Chart without leaving the dialog box.
-
Explore the data on the Chart using the tools in the Chart mini-toolbar. See Drill Down into Data for information about how to view chart details, zoom the chart, brush the chart, etc.