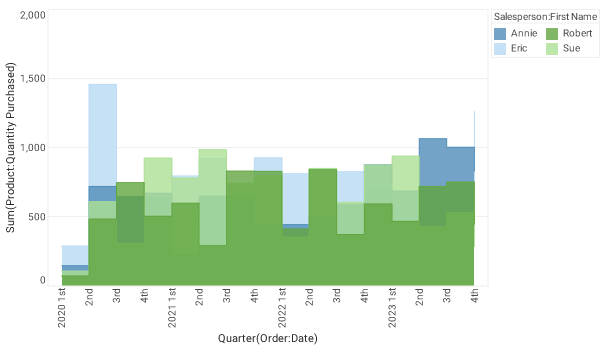
Step Area Chart
A step area chart is a type of Area Chart that connects the measure data points by using only the horizontal and vertical directions.
What is a measure?A measure is generally used for aggregation, for example summation, averaging, correlation, etc., within a Crosstab, Chart, Text component, or Gauge. Adding a measure to the ‘Y’ region in a chart displays the computed aggregates by using locations on the Y-axis. Adding a measure to the ‘X’ region displays the computed aggregates by using locations on the X-axis. You can also display aggregates by using color, shape, size, or label. |
The Step Area Chart is functionally the same as the Step Line Chart. See Step Line Chart for full instructions on how to create this type of chart.
When you press the ‘Select Chart Style’ button  , simply select ‘Step Area’ instead of ‘Step Line’. , simply select ‘Step Area’ instead of ‘Step Line’.
|