GShape.create(outline, fill)
Creates a GShape object. (See GShape.setFillColor(color) to set the interior color of the shape.)
Parameters
- outline
-
true: draw a border for the shape
false: suppress border - fill
-
trueto fill the shape with color
false: leave shape empty
Example
Chart Component Script
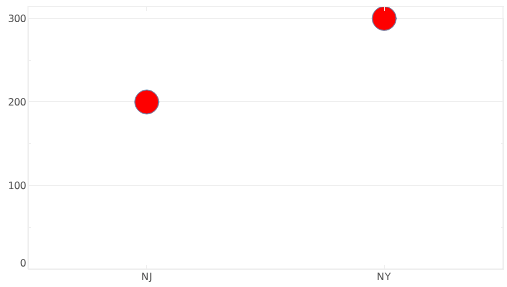
dataset = [["State","Quantity"], ["NJ",200], ["NY",300]]; (1)
graph = new EGraph();
var elem = new PointElement("State","Quantity");
var circle = GShape.CIRCLE.create(true, true); (2)
circle.setFillColor(java.awt.Color.RED);
var shapeFrame = new StaticShapeFrame(circle); (3)
var sizeFrame = new StaticSizeFrame(10);
elem.setSizeFrame(sizeFrame);
elem.setShapeFrame(shapeFrame); (4)
graph.addElement(elem);| 1 | See dataset to use a data block instead of an array literal. |
| 2 | Use create() to create the shape. |
| 3 | Pass the shape to the StaticShapeFrame constructor. |
| 4 | Use GraphElement.setShapeFrame(frame) to add the ShapeFrame to the IntervalElement.
|
Script that modifies the graph or dataset properties should be placed on the Chart component itself. See Add Component Script for more information. This script has access to the Chart data and Chart API methods. Scripted Charts are not good candidates for user-modification, so you should deselect ‘Enable Ad Hoc Editing’ in the Chart Properties dialog box.
|