Create a Chart with API
The previous sections, Modify Chart Data Binding and Modify Chart Element, explained how to modify the data binding and element properties of an existing Chart. This section explains how to create a new Chart (from the ground-up) using Chart API commands.
| Charts created by script do not provide end-user interactivity features. Therefore, for script-based charts you should deselect ‘Enable Ad Hoc Editing’ in the ‘Chart Properties’ panel (Advanced tab). |
Walkthrough
In this example, you will create a new Chart, define the Chart data, and display the data on the Chart. Follow the steps below:
-
Add a new Chart to the Dashboard.
-
Open the Script Editor: Right-click the Chart and select ‘Properties’ from the context menu. Then select the Script tab.
Chart API script (which operates on the Chart’s 'EGraph' property) should be placed in element-level script. -
Define the data: Define the dataset for the Chart using the Chart’s data property.
data = runQuery("ws:global:Examples/AllSales");You will generally obtain the data from a Data Worksheet by using runQuery(name [,parameters]). You can also define your own dataset in script by assigning a JavaScript array to the
dataordatasetproperty.
See Bind Data to Chart in Script for more details.
-
Create the Chart object. Create a new graph using the EGraph constructor.
EGraphis the global chart object, which includes all axes, legends, visual elements, etc. Assign it to the Chart’sgraphproperty.graph = new EGraph(); -
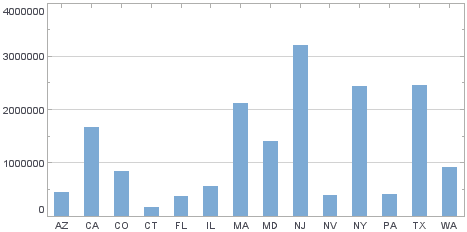
Create the Chart data elements. Pass the field names (column headers) to a GraphElement constructor. This creates the representational elements (e.g., bars) for the Chart.
var elem = new IntervalElement("State", "Sales");The IntervalElement is a particular type of
GraphElementthat creates “bars” or “intervals” as the representational elements. OtherGraphElements, such as PointElement and LineElement, generate other kinds of chart types, such as scatter plots and line plots, respectively. -
Add the created elements to the Chart object. Pass the
GraphElementobject to the Chart’s EGraph.addElement(elem) method. This adds the “bar” elements to the existing Chart object.graph.addElement(elem); -
Close the Script Editor and press the ‘Preview’ button
 to preview the Dashboard.